Time Zone: GMT +3
Time Frame: 4 Hours (H4)
Fundamental Analysis:
The GBP-USD pair today faces significant volatility potential stemming from major economic releases. From the UK, traders eagerly await key data from the Office for National Statistics, including Gross Domestic Product (GDP), Construction Output, Trade Balance, Gross Value Added (GVA), and both Industrial and Manufacturing Production figures. Positive readings compared to forecasts can significantly strengthen GBP, indicating robust economic health and potentially increasing bullish momentum. Conversely, the US Dollar (USD) eyes the University of Michigan’s consumer sentiment and inflation expectation reports. Stronger-than-expected data could boost USD, exerting bearish pressure on GBP/USD.
Price Action:
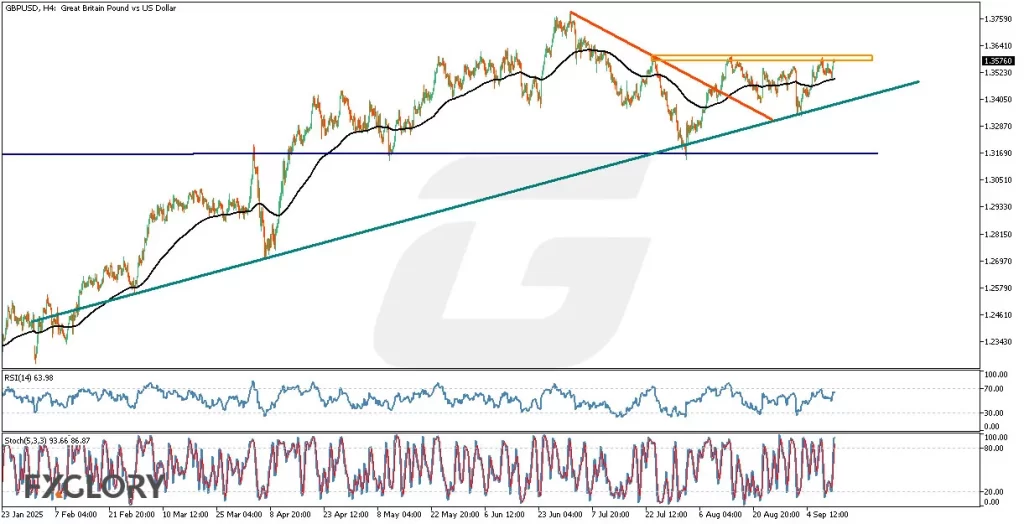
The GBPUSD pair on the H4 timeframe exhibits a classic ascending triangle formation, indicative of bullish pressure. Price action has repeatedly tested the clearly defined horizontal resistance (supply zone) around 1.2576 (orange zone). Concurrently, the pair demonstrates consistently rising higher lows along the ascending teal trendline. The previous downtrend (red line) has been decisively broken, suggesting a bullish shift. Traders should closely monitor a confirmed breakout via a solid H4 close above resistance or below rising support to identify directional bias.
Key Technical Indicators:
EMA (90): The EMA (90) has consistently supported GBPUSD’s price, reinforcing bullish sentiment. It currently acts as dynamic support, underpinning recent higher lows and guiding price upward.
RSI (14): At 64, the RSI indicator on GBPUSD indicates solid bullish momentum without entering overbought territory. This signals room for further upside potential before exhaustion sets in, supporting bullish continuation.
Stoch (5,3,3): The Stochastic Oscillator registers values of 94 and 87, suggesting immediate short-term overbought conditions. This indicates caution for potential short-term corrections, despite broader bullish momentum.
Support and Resistance:
Support: Immediate support lies along the ascending trendline around 1.2480. Secondary support is significantly lower, near the prior demand zone and breakout base at approximately 1.2300.
Resistance: Immediate resistance is established at the flat supply zone around 1.2576. A decisive break above this level opens potential bullish targets near 1.2700-1.2750 based on measured moves.
Conclusion and Consideration:
The GBP-USD pair’s current H4 analysis signals bullish potential supported by ascending triangle price action, reinforced by EMA (90), RSI, and Stochastic indicators. However, the overbought Stochastic signals potential short-term volatility and pullbacks. Upcoming key economic data releases from both GBP and USD can significantly influence market dynamics and catalyze the breakout direction. Traders should wait for a clear H4 candle close outside the triangle to confirm entry, using prudent stop-loss placements and volatility buffers to manage breakout risks effectively.
Disclaimer: The analysis provided for GBP/USD is for informational purposes only and does not constitute investment advice. Traders are encouraged to perform their own analysis and research before making any trading decisions on GBPUSD. Market conditions can change quickly, so staying informed with the latest data is essential.