Time Zone: GMT +3
Time Frame: 4 Hours (H4)
Fundamental Analysis:
Bitcoin (BTC) against the US Dollar (USD) remains highly sensitive to global macroeconomic news and upcoming US data releases. Today, traders will be watching the US API Weekly Statistical Bulletin along with upcoming EIA crude oil inventories and wholesale inventories reports, which can influence USD liquidity and risk sentiment. Additionally, the Producer Price Index (PPI) scheduled for release in October remains a key inflation measure, affecting Federal Reserve policy expectations. Given the strong correlation between USD strength and Bitcoin’s volatility, any deviation from forecasts in these indicators could lead to sharp intraday price movements.
Price Action:
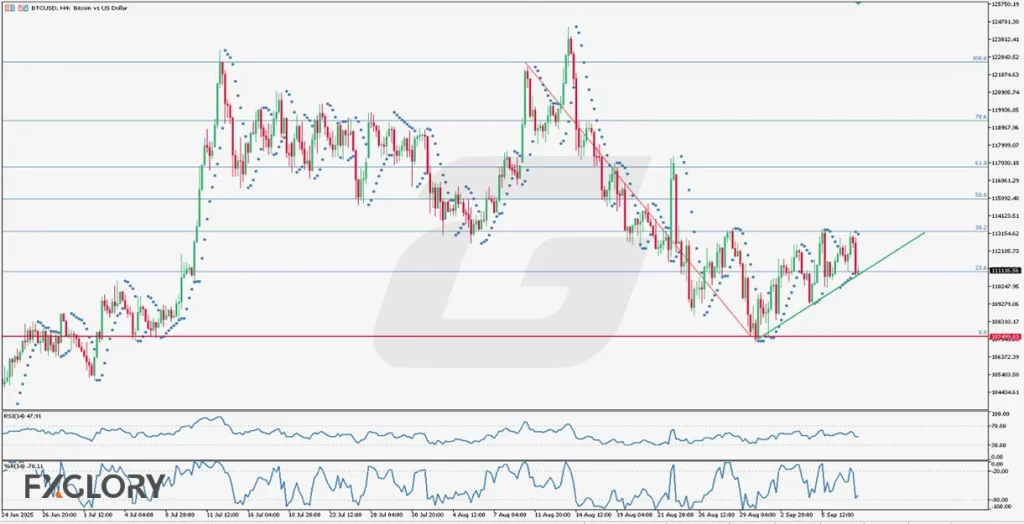
After recording a new all-time high at 124,508 USD on August 14th, BTC/USD entered a corrective downtrend, touching the 0% Fibonacci retracement at 107,250 USD. Since then, the pair has rebounded and broken above the 23.6% retracement level, before testing resistance at the 38.2% Fibonacci zone near 113,400 USD. However, price failed twice to break above this level, pulling back towards 23.6%. A new ascending trendline has formed, showing a gradual bullish recovery with the latest candle bouncing off support. Traders should closely monitor whether Bitcoin can sustain above the trendline and attempt another retest of the 38.2% retracement level.
Key Technical Indicators:
Parabolic SAR: The last two Parabolic SAR dots appeared above the candles, signaling ongoing bearish pressure. A new SAR dot forming below the candles would be an early confirmation of a potential bullish continuation in BTC/USD on the H4 timeframe.
RSI (14): The Relative Strength Index is currently at 47.91, indicating a neutral zone slightly below the 50 level. This suggests that BTC/USD is neither overbought nor oversold, and momentum remains balanced but fragile.
Williams %R (14): Currently at -70.11, the Williams %R suggests that Bitcoin is leaning towards oversold conditions but not yet fully extended. This could indicate a potential bounce if buyers defend the trendline and 23.6% Fibonacci support.
Support and Resistance:
Support: Key support rests near 110,300 USD, aligned with the 23.6% Fibonacci level and ascending trendline.
Resistance: Immediate resistance is at 113,400 USD, the 38.2% Fibonacci retracement zone, followed by stronger resistance at 115,600 USD.
Conclusion and Consideration:
The BTC/USD H4 technical analysis suggests that Bitcoin is currently consolidating between the 23.6% and 38.2% Fibonacci retracement levels after rebounding from its local low at 107,250 USD. The neutral RSI, oversold Williams %R, and Parabolic SAR positioning highlight indecision, but the ascending trendline supports a short-term bullish bias. Traders should monitor whether Bitcoin can sustain above the 110,300 USD support to retest 113,400 USD resistance. A breakout above this level could extend gains towards 115,600 USD, while a break below the trendline may trigger another downside test near 107,250 USD.
Disclaimer: The analysis provided for BTC/USD is for informational purposes only and does not constitute investment advice. Traders are encouraged to perform their own analysis and research before making any trading decisions on BTCUSD. Market conditions can change quickly, so staying informed with the latest data is essential.