Time Zone: GMT +3
Time Frame: 4 Hours (H4)
Fundamental Analysis:
The XAUUSD (Gold) price today faces potential volatility influenced by upcoming economic data releases. The American Petroleum Institute (API) will issue its weekly report on September 16, potentially affecting market sentiment, especially with energy prices indirectly impacting inflation expectations and gold’s appeal as an inflation hedge. Additionally, the National Federation of Independent Business (NFIB) will release its Small Business Index on October 14, 2025, providing insights into economic conditions in the US. A better-than-forecast result typically strengthens the USD, potentially weighing down gold prices.
Price Action:
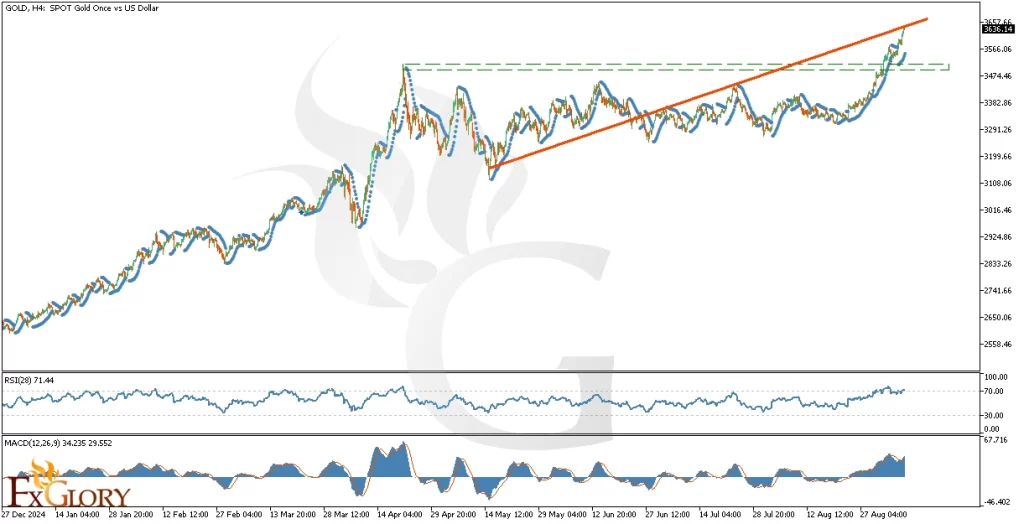
Gold (XAUUSD) analysis on the H4 timeframe reveals a robust bullish trend reaching a new all-time high (ATH). After a sharp upward movement, the price now encounters significant resistance, indicating the potential start of a corrective phase. The latest bearish candle formation signals sellers stepping in, suggesting a possible short-term retracement or consolidation before resuming upward momentum.
Key Technical Indicators:
Parabolic SAR: Recent dots appear below the price and are widening, indicating sustained bullish momentum. However, the widening suggests an increase in volatility and the likelihood of a short-term pullback or correction.
RSI (28): Currently at 71.44, the RSI indicates the asset is in overbought territory. This signals that bullish momentum might be nearing exhaustion, hinting at a potential correction or sideways consolidation before any continuation upward.
MACD (12,26,9): The MACD line at 34.2 remains above the signal line at 29.5, highlighting a bullish sentiment. However, the narrowing gap implies declining bullish strength and possible bearish crossover soon, cautioning traders about potential reversals.
Support and Resistance:
Support: Immediate support is at 2,075.00, coinciding with previous resistance-turned-support levels. Further down, key psychological support lies at the 2,050.00 mark.
Resistance: The major resistance level is at the current ATH around 2,120.00, where price action has encountered selling pressure and hesitation.
Conclusion and Consideration:
The XAUUSD H4 chart suggests bullish momentum is currently dominant but increasingly vulnerable to correction. The Parabolic SAR, RSI, and MACD indicators collectively support a cautious bullish outlook while hinting at imminent retracement risks. Traders should closely monitor support at 2,075.00 and resistance at 2,120.00, particularly ahead of API and NFIB releases that could influence the USD and indirectly impact gold price movements. Risk management remains crucial due to potential volatility spikes.
Disclaimer: The analysis provided for XAU/USD is for informational purposes only and does not constitute investment advice. Traders are encouraged to perform their own analysis and research before making any trading decisions on XAUUSD. Market conditions can change quickly, so staying informed with the latest data is essential.