Time Zone: GMT +3
Time Frame: 4 Hours (H4)
Fundamental Analysis:
Today, key economic indicators from both Europe and Japan are scheduled for release, potentially influencing the EURJPY pair significantly. From Europe, Industrial Output and Foreign Trade Balance figures from Destatis are awaited, alongside the Sentix Investor Confidence index. Positive results here, exceeding forecasts, could bolster the Euro (EUR). Conversely, Japan’s financial calendar highlights changes in bank loans, current account balance, and consumer sentiment through the Eco Watchers Index. Stronger-than-expected Japanese data could strengthen the Japanese Yen (JPY), applying downward pressure on the EUR-JPY pair.
Price Action:
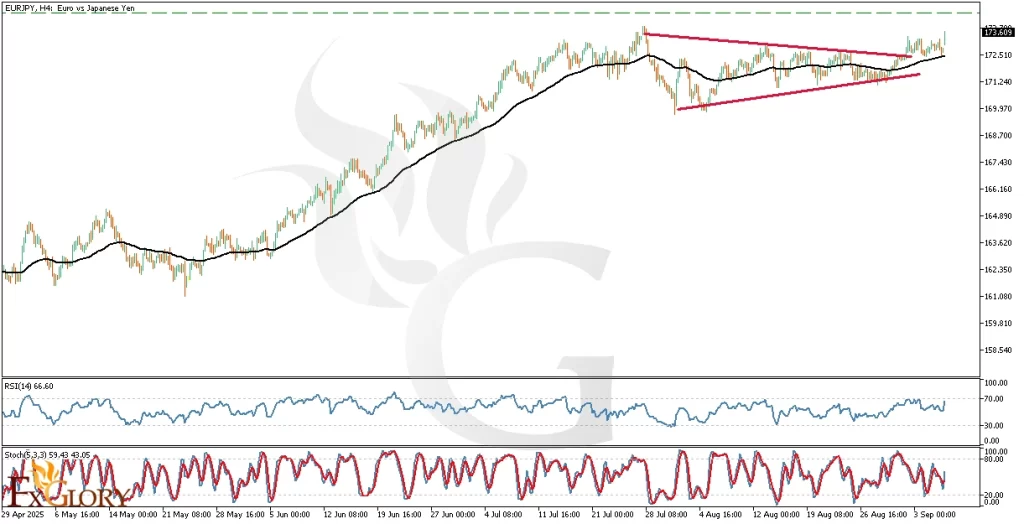
EUR/JPY is currently exhibiting clear bullish price action on the H4 chart. Following a prolonged consolidation phase within a symmetrical triangle pattern, the pair has broken decisively upwards. A robust bullish Marubozu candle confirms bullish momentum resurgence, implying that the correctional sideways phase has ended. Price is now targeting a retest of the recent high between 174.5 – 175.5, affirming a continuation of the established bullish trend.
Key Technical Indicators:
EMA (55): The Exponential Moving Average (55-period) is trending below the current price, acting as dynamic support. The EMA line provided recent support, further reinforcing bullish sentiment on the EURJPY H4 chart.
RSI (14): The Relative Strength Index currently stands at 66.6, suggesting the pair is approaching, but not yet at, overbought levels. This provides scope for further upside momentum before cautioning against potential exhaustion.
Stochastic Oscillator (5,3,3): The Stochastic indicator is at 59.43 and 43.05, indicating a neutral stance but with room for further bullish advancement. Traders should watch closely for upward crossovers to confirm continued bullish sentiment.
Support and Resistance:
Support: Immediate support is established at 172.50, aligning with the recent breakout point and the EMA (55). Further downside support can be found at the lower boundary of the previous consolidation pattern around 171.20.
Resistance: The near-term resistance lies between 174.5 and 175.5, coinciding with recent historical highs. Breaking through these levels could pave the way for significant bullish extensions.
Conclusion and Consideration:
The EUR-JPY H4 chart clearly supports a continuation of the bullish trend, underpinned by strong price action, EMA dynamics, and supportive RSI and Stochastic readings. However, traders must stay vigilant to fundamental economic news from Europe and Japan today, which could induce volatility. A sustained move above 174.5-175.5 would solidify the bullish outlook.
Disclaimer: The analysis provided for EUR/JPY is for informational purposes only and does not constitute investment advice. Traders are encouraged to perform their own analysis and research before making any trading decisions on EURJPY. Market conditions can change quickly, so staying informed with the latest data is essential.