Time Zone: GMT +3
Time Frame: 4 Hours (H4)
Fundamental Analysis
The USD-JPY pair is currently influenced by significant economic news from both the US and Japan. Today, traders will closely monitor the US Federal Reserve Governor Christopher Waller’s speech regarding monetary policy and inflation, potentially driving volatility for the USD. Additionally, US Personal Consumption Expenditures (PCE) data, income, and consumer spending reports are anticipated, each critically influencing USD valuation. On the JPY side, key indicators like Tokyo CPI, Jobless Rate, Industrial Production, Retail Trade, and Consumer Confidence are expected to shape trading sentiment and currency fluctuations significantly, possibly providing directional momentum to the pair.
Price Action
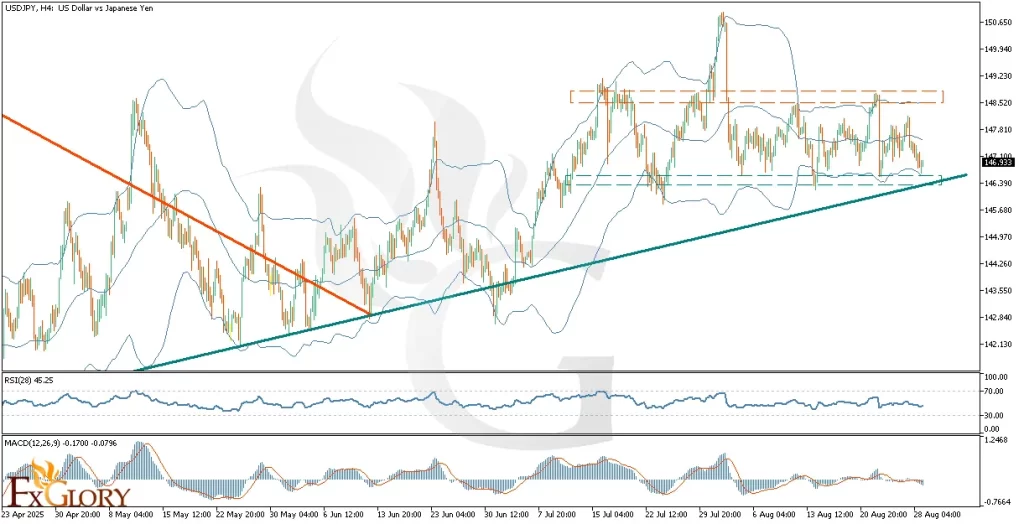
The USD/JPY pair on the H4 timeframe displays a transition from a previous downtrend, clearly broken by an upward momentum, evolving now into a sideways movement. Currently, the price is positioned at a critical horizontal support zone and an ascending support trendline, forming a hammer candlestick pattern signaling potential reversal. If bullish momentum confirms, the price may initially target the Bollinger Bands’ midline around 147.48, with a potential continuation toward the upper band coinciding with the horizontal resistance zone.
Key Technical Indicators
Bollinger Bands: The Bollinger Bands have flattened significantly, indicating a consolidation phase with low volatility. The price is currently at the lower band, suggesting it could rebound toward the mid-band, implying potential bullish movement in the short term.
RSI (28): The RSI currently stands at 45.25, showing neutral market sentiment. This moderate reading suggests the USDJPY has ample room to rise without immediate risk of becoming overbought, reinforcing the possibility of bullish momentum continuation.
MACD (12,26,9): The MACD indicator shows a slightly negative histogram and a MACD line closely hugging the signal line, implying indecision and weak bearish momentum. Traders should watch for a bullish crossover as a signal to confirm a bullish scenario.
Support and Resistance
Support: Immediate support at 146.93, aligning with the horizontal support zone and ascending trendline. Further support observed at the psychological level of 146.39.
Resistance: Key resistance levels are identified at 147.48 (mid Bollinger Band) and stronger resistance at 148.52 (horizontal resistance and upper Bollinger Band).
Conclusion and Consideration
In conclusion, the USD-JPY H4 technical and fundamental chart analysis indicates a potential bullish reversal scenario supported by price action, Bollinger Bands, and neutral RSI. However, MACD suggests caution until clearer bullish signals emerge. Traders must carefully monitor today’s high-impact economic news from the US and Japan, which could introduce significant volatility and impact the USD Vs. JPY currency pair’s directional bias.
Disclaimer: The analysis provided for USD/JPY is for informational purposes only and does not constitute investment advice. Traders are encouraged to perform their own analysis and research before making any trading decisions on USDJPY. Market conditions can change quickly, so staying informed with the latest data is essential.


