Time Zone: GMT +3
Time Frame: 4 Hours (H4)
Fundamental Analysis:
The GBP/USD pair today is influenced by key upcoming economic news on both the US Dollar (USD) and the British Pound (GBP). From the US side, traders will be closely monitoring the API and EIA crude oil inventory data, which usually impacts USD indirectly through energy-related price volatility, as well as a speech from Richmond Fed President Thomas Barkin that could provide further signals on Federal Reserve monetary policy. Hawkish commentary from FOMC members tends to support the USD, while dovish signals may weaken it. On the UK side, the Confederation of British Industry (CBI) Distributive Trades Survey will be released, reflecting consumer spending patterns. A stronger-than-expected CBI reading would support the GBP, while weaker results may exert downward pressure. Overall, mixed fundamentals suggest that GBP USD could remain volatile throughout today’s trading session.
Price Action:
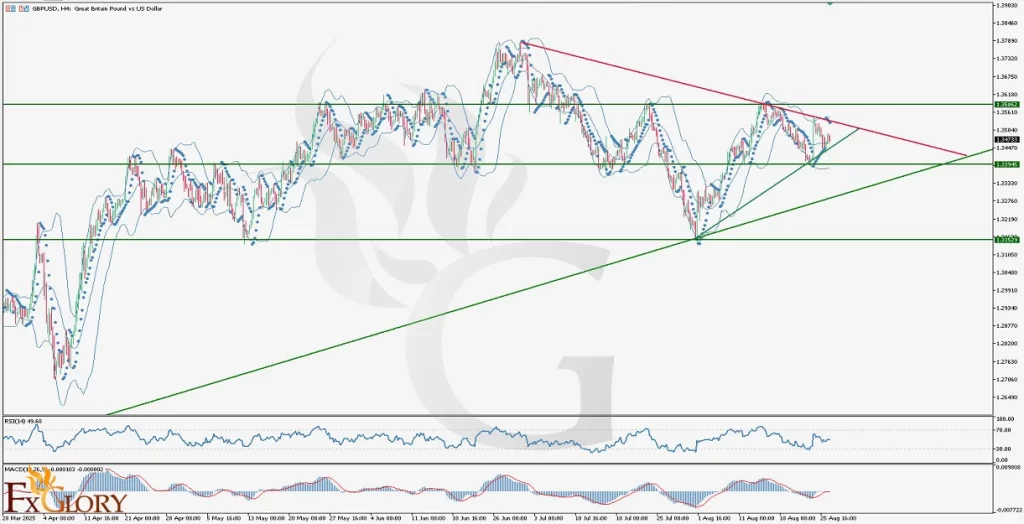
On the H4 chart, GBP/USD price action shows that the pair is currently consolidating within a rectangle pattern, trapped between major support and resistance. The price has been respecting a long-term bullish trendline while at the same time struggling with a descending bearish trendline drawn from the mid-July highs. Since the beginning of August, the price has corrected upward from 1.3150 lows but is now facing resistance near the 1.3586 level. Currently, GBP/USD trades near the Bollinger Bands’ middle line, reflecting indecision and potential breakout conditions in either direction.
Key Technical Indicators:
Bollinger Bands: GBP/USD is moving around the middle Bollinger Band, with the last candles showing compression. This indicates reduced volatility and the possibility of an upcoming breakout. The upper band aligns closely with resistance near 1.3586, while the lower band supports the 1.3394 zone.
Parabolic SAR: The last four Parabolic SAR dots are positioned above the candles, signaling bearish pressure. As long as SAR remains above price action, short-term sentiment may lean bearish, but a flip below candles would indicate renewed bullish momentum.
RSI (Relative Strength Index): The RSI currently stands at 49.68, reflecting a neutral stance. This midpoint suggests that GBPUSD has not entered overbought or oversold territory, supporting the idea of consolidation before a potential breakout.
MACD (Moving Average Convergence Divergence): The MACD line at -0.000103 and the signal line at -0.000002 show weak bearish momentum. The histogram remains flat, indicating a lack of strong directional bias. Traders should monitor for a potential crossover to confirm momentum shifts.
Support and Resistance:
Support: Strong support lies near 1.3394, followed by deeper support at 1.3153. These levels align with trendline confluence and recent swing lows.
Resistance: The nearest resistance is at 1.3586, where the descending trendline and previous highs converge, acting as a strong barrier for buyers.
Conclusion and Consideration:
The GBP/USD H4 technical and fundamental analysis suggests that the pair is currently consolidating within a critical range, supported by a long-term bullish trendline but capped by a strong descending resistance line. Key technical indicators, including Bollinger Bands, RSI, MACD, and Parabolic SAR, point to indecision, with a potential breakout likely as volatility compresses. Traders should closely monitor today’s fundamental news from both the US and UK, as the combination of API/EIA crude data, FOMC commentary, and CBI survey results could trigger sharp moves.
Disclaimer: The analysis provided for GBP/USD is for informational purposes only and does not constitute investment advice. Traders are encouraged to perform their own analysis and research before making any trading decisions on GBPUSD. Market conditions can change quickly, so staying informed with the latest data is essential.