Time Zone: GMT +3
Time Frame: 4 Hours (H4)
Fundamental Analysis:
The USD-CAD pair reflects the exchange rate between the US Dollar (USD) and the Canadian Dollar (CAD). Today, significant volatility can be expected in USD-related pairs due to multiple key events. Federal Reserve Bank of New York President John Williams and Richmond President Thomas Barkin are scheduled to speak, potentially impacting monetary policy sentiment. Data on Durable Goods Orders excluding transportation items will be closely watched as they serve as leading indicators for manufacturing activity. Additionally, Bank of Canada Governor Tiff Macklem’s speech on flexible inflation targeting at the Bank of Mexico Centennial Conference could induce CAD volatility. Traders should remain cautious and alert to sudden market moves.
Price Action:
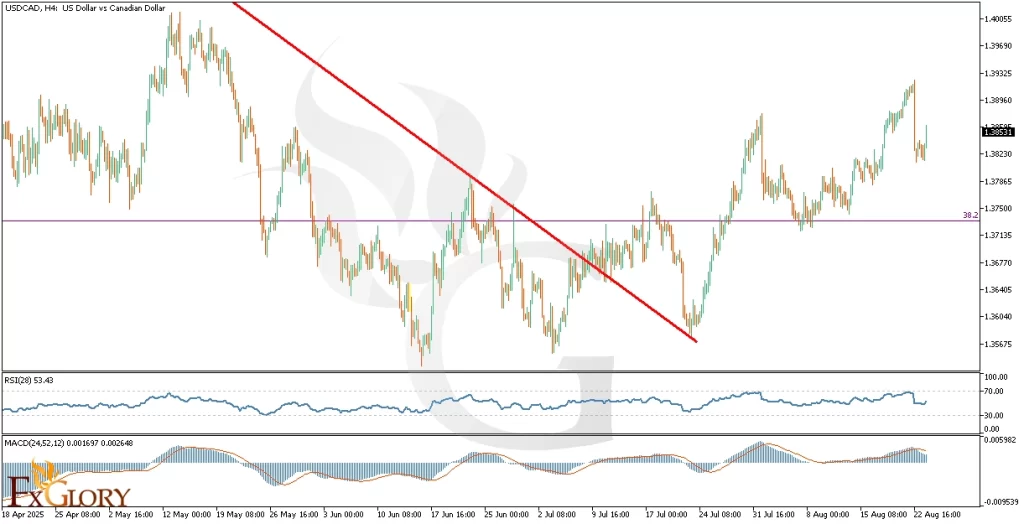
The USD/CAD pair has shown a clear bullish price action on the H4 timeframe. After maintaining an overall uptrend since mid-2021, the recent correction to Fibonacci retracement levels between 38.2% and 50% appears to have completed. Price has rebounded decisively, signaling a continuation of the bullish momentum. The market is currently aiming at the 23.6% Fibonacci retracement level, but the psychological resistance zone at 1.40000 remains a critical test ahead. Traders should closely monitor candlestick patterns around this key resistance for potential reversals or continuations.
Key Technical Indicators:
RSI (28): Currently at 53.4, the RSI indicates balanced market conditions, with neither overbought nor oversold levels present. This mid-level position allows ample room for the price to move higher, supporting the potential continuation of the bullish trend in USD CAD.
MACD (24,52,12): With values of 0.001697 and 0.002648, the MACD indicator shows bullish momentum, as the MACD line remains above the signal line. The positive histogram further confirms sustained bullish pressure. Traders should monitor the MACD closely for any divergence signs that might indicate a weakening trend.
Support and Resistance:
Support: Immediate support stands at the 1.3750 Fibonacci level, aligned with recent swing lows and the previous correction bottom.
Resistance: Key resistance is located at the psychological 1.4000 level, a major barrier that could potentially halt or slow down bullish momentum before price reaches the Fibonacci 23.6% retracement.
Conclusion and Consideration:
The USD VS. CAD H4 chart analysis suggests a bullish outlook supported by current fundamental factors, recent price action, and technical indicators. Price action has returned to its broader uptrend after a healthy Fibonacci correction, with indicators pointing towards further bullish potential. However, traders must exercise caution due to today’s high-impact speeches and durable goods data, potentially introducing market volatility.
Disclaimer: The analysis provided for USD/CAD is for informational purposes only and does not constitute investment advice. Traders are encouraged to perform their own analysis and research before making any trading decisions on USDCAD. Market conditions can change quickly, so staying informed with the latest data is essential.