Time Zone: GMT +3
Time Frame: 4 Hours (H4)
Fundamental Analysis:
Today’s NZD/USD H4 technical and fundamental analysis is influenced by a significant wave of economic data from New Zealand and the United States. From the NZD side, market participants are closely watching employment figures, unemployment rates, and labor cost changes. These indicators are essential for understanding the health of New Zealand’s labor market, a crucial driver of consumer spending and inflation. While no releases are scheduled for today, anticipation builds for the next quarterly labor data in early November, potentially setting the tone for the NZD in the coming weeks. On the USD side, attention shifts to energy-related reports and monetary policy commentary. Crude Oil Inventory levels from the EIA, expected later this week, may impact overall risk sentiment and indirectly influence USD valuation. Moreover, FOMC members Lisa Cook and Susan Collins are scheduled to speak today. Their commentary could offer crucial insights into the Fed’s monetary policy direction, influencing USD demand and NZD-USD exchange rates.
Price Action:
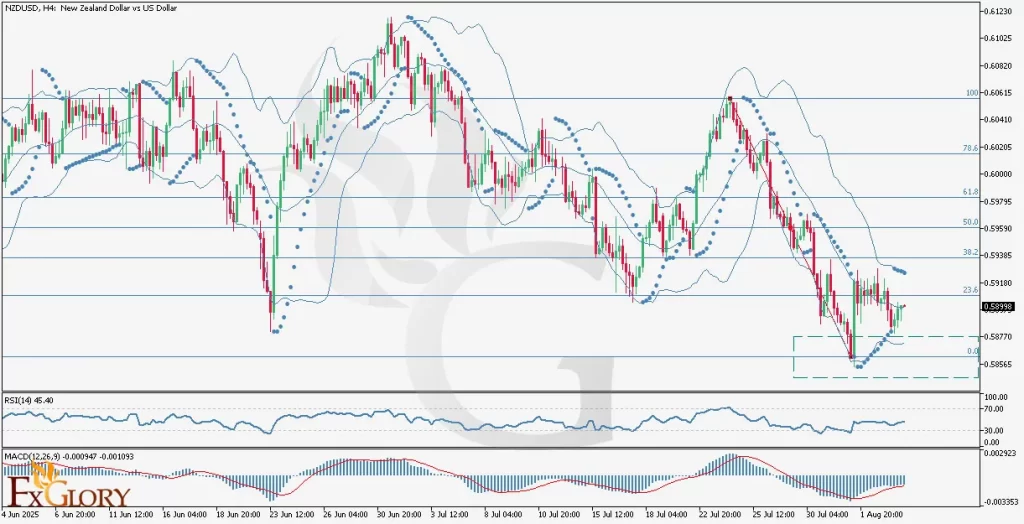
The NZD/USD price action on the H4 chart has shown a predominantly bearish trend. After a significant downward movement, the pair touched the 0.58565 support area, which coincides with the 0.0 Fibonacci retracement level. Following that, the price rebounded toward the 23.6% Fib level, struggling to establish a clear breakout. Despite forming three consecutive bullish (green) candles, the most recent candle has turned red, suggesting hesitation from the bulls at this critical resistance zone. The pair remains range-bound between the 0.58565 support and 0.58990 resistance, consolidating below the 38.2% Fibonacci retracement.
Key Technical Indicators:
Bollinger Bands: The NZD/USD price has been fluctuating between the lower and middle Bollinger Bands, indicating low volatility and range-bound behavior. After briefly touching the lower band, the price is attempting to break through the middle band, aligning with the 23.6% Fib level. However, the rejection shown by the red candle suggests resistance and potential consolidation unless a clear bullish breakout occurs.
Parabolic SAR: The last four Parabolic SAR dots are aligned above the price candles, signaling a continuation of the bearish trend. Until the dots flip below the candles, momentum remains in favor of the bears, and traders may look for selling opportunities near resistance.
RSI (Relative Strength Index): The RSI stands at 45.40, which is below the neutral 50 level, indicating slight bearish momentum. It is not in oversold territory, so there is still room for further downside before the market becomes technically oversold.
MACD (Moving Average Convergence Divergence): The MACD line is at -0.000947, with the signal line at -0.001093, and the histogram is gradually turning positive. This could suggest that bearish momentum is weakening, and a potential crossover could occur soon. However, confirmation is required for a trend reversal signal.
Support and Resistance:
Support: Key support lies around 0.58565, which is aligned with the recent low and the 0.0 Fibonacci level, acting as a psychological and technical floor.
Resistance: Immediate resistance is found at 0.59000, near the 23.6% Fibonacci retracement level and the middle Bollinger Band, forming a strong confluence area.
Conclusion and Consideration:
In today’s NZD/USD H4 chart forecast, the pair is attempting to recover from its recent lows but faces stiff resistance at the 23.6% Fibonacci retracement level. Technical indicators such as Bollinger Bands and Parabolic SAR suggest consolidation or potential downside continuation, while the RSI and MACD hint at possible bullish momentum buildup. Fundamental factors remain balanced, with upcoming U.S. central bank commentary and crude oil inventory data possibly tilting sentiment in favor of the USD. Traders should remain cautious and watch for a breakout from the current range to determine the next directional bias.
Disclaimer: The analysis provided for NZD/USD is for informational purposes only and does not constitute investment advice. Traders are encouraged to perform their own analysis and research before making any trading decisions on NZDUSD. Market conditions can change quickly, so staying informed with the latest data is essential.