Time Zone: GMT +3
Time Frame: 4 Hours (H4)
Fundamental Analysis:
The GBPUSD pair is subject to notable volatility today, given the release of key economic indicators for both currencies. For the British Pound (GBP), traders are closely watching the UK’s Services PMI from S&P Global and results from the Debt Management Office’s 10-year bond auctions. These indicators could heavily influence the GBP’s strength, reflecting current market conditions and investors’ outlook on UK economic health. For the US Dollar (USD), attention will be drawn towards the trade balance report from the Bureau of Economic Analysis, as well as the Services PMI from both S&P Global and the Institute for Supply Management (ISM). These indicators could lead to volatility in the USD, impacting GBP-USD trading conditions significantly.
Price Action:
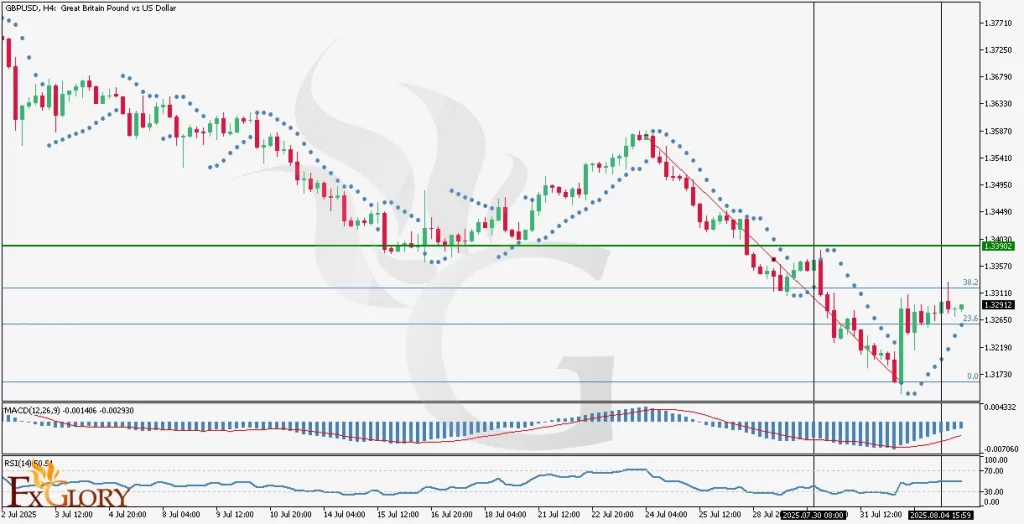
GBP/USD price action on the H4 chart indicates a predominant bearish trend. After a short reversal, bearish momentum resumed with notable strength. Each drop in price has been accompanied by minor and flat corrective phases. The most recent correction is sharper, currently hovering between Fibonacci retracement levels of 23.6% and 38.2%. Should these levels fail to contain the correction, the next critical resistance area lies at 1.33902, historically a zone with significant price reactions. The RSI divergence pattern suggests a likely continuation of the bearish trend.
Key Technical Indicators:
MACD (Moving Average Convergence Divergence): The MACD line stands at -0.002930, with the histogram level at -0.001406, indicating that bearish momentum persists but is currently weaker. Traders should monitor for potential crossovers signaling either continued bearish momentum or a reversal.
RSI (Relative Strength Index): The RSI indicator currently hovers around the 50.51 level, signifying a neutral market sentiment. Given the RSI divergence with higher highs compared to the lower highs in price, traders should anticipate potential bearish continuation.
Parabolic SAR: The Parabolic SAR dots are placed below the current candles, signaling the potential continuation of the correction phase. This indicator reinforces the likelihood of upward continuation unless reversed by a clear downward move.
Support and Resistance:
Support: Immediate support lies at the recent low around the 1.31730 level, serving as a crucial psychological and technical floor.
Resistance: Immediate resistance is marked at 1.33902, aligning with significant historical price reactions and the Fibonacci retracement levels.
Conclusion and Consideration:
The GBPUSD technical and fundamental analysis for the H4 timeframe underscores ongoing bearish sentiment, supported by RSI divergence, MACD weakening bearish momentum, and Parabolic SAR alignment. The upcoming economic news from the UK and the US could significantly affect volatility and market direction. Traders should remain cautious, factoring in these fundamental releases to refine their strategies.
Disclaimer: The analysis provided for GBP/USD is for informational purposes only and does not constitute investment advice. Traders are encouraged to perform their own analysis and research before making any trading decisions on GBPUSD. Market conditions can change quickly, so staying informed with the latest data is essential.