Time Zone: GMT +3
Time Frame: 4 Hours (H4)
Fundamental Analysis:
The USD-JPY currency pair is likely to experience increased volatility today due to significant economic releases from both Japan and the United States. Japanese Industrial Production, Retail Sales, and Consumer Confidence data are scheduled, which will provide crucial insights into the economic health of Japan. Additionally, market participants will closely monitor the outcomes of the Bank of Japan’s monetary policy statements and comments by the BOJ Governor for indications of future policy shifts. From the U.S. side, traders will pay close attention to the Core PCE Price Index and Unemployment Claims, which can significantly influence the USD valuation, as these metrics directly affect the Federal Reserve’s monetary policy outlook.
Price Action:
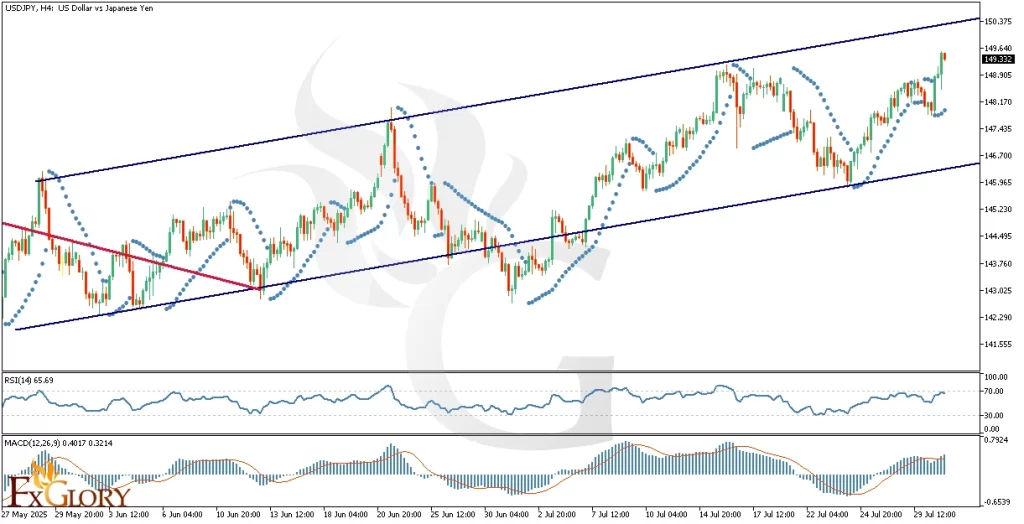
The USD/JPY pair has transitioned into a bullish phase on the H4 chart, clearly evident after breaking the resistance line of its previous downtrend. Currently, the pair is trading within an ascending channel, consistently respecting its boundaries. After recently bouncing off the channel’s lower trendline, the price appears headed toward the upper boundary, setting a potential bullish target. The recent bullish candles reinforce the upward momentum, suggesting continued bullish sentiment in the short term.
Key Technical Indicators:
Parabolic SAR: The Parabolic SAR indicators have consistently formed below the last four candles, indicating a clear bullish momentum in the short-term price action of the USD JPY pair. Traders can interpret this as a potential continuation signal toward the upper channel boundary.
RSI (Relative Strength Index): Currently, the RSI stands at 65.69, signaling robust bullish strength but still beneath the overbought threshold of 70. This indicates that while bullish momentum is strong, there is still room for further upside before becoming overextended.
MACD (Moving Average Convergence Divergence): The MACD indicator presents values of 0.4017 and 0.3214, with the MACD line positioned above the signal line, supporting the bullish scenario. This positioning suggests continued buying momentum, albeit with caution for potential weakening if the MACD line converges toward the signal line in upcoming sessions.
Support and Resistance:
Support: Immediate support for the USD-JPY pair is found at approximately 147.435, aligning with the lower boundary of the ascending channel and recent swing lows.
Resistance: Key resistance is expected near the upper boundary of the ascending channel around 149.640, coinciding with recent peaks that could challenge bullish momentum.
Conclusion and Consideration:
The USD-JPY H4 chart currently favors bullish continuation, supported by key technical indicators such as Parabolic SAR, RSI, and MACD, along with constructive price action within the ascending channel. However, market participants should remain cautious given today’s significant economic data and monetary policy announcements from both Japan and the United States, potentially increasing volatility. Monitoring key resistance and support levels will be essential to effectively manage trading positions.
Disclaimer: The analysis provided for USD/JPY is for informational purposes only and does not constitute investment advice. Traders are encouraged to perform their own analysis and research before making any trading decisions on USDJPY. Market conditions can change quickly, so staying informed with the latest data is essential.