Time Zone: GMT +3
Time Frame: 4 Hours (H4)
Fundamental Analysis:
Today’s EUR/USD analysis is framed by multiple Eurozone macroeconomic indicators due for release. With data on consumer spending, GDP, and retail sales scheduled, traders are closely watching for signs of economic resilience. A stronger-than-forecast reading would typically be bullish for the euro, especially from the INSEE and Destatis GDP reports. Meanwhile, the USD awaits impactful data later in the week, including ADP employment data and crude oil inventories, which may shift the Fed’s interest rate expectations. For now, mixed macro signals leave EUR/USD highly sensitive to incoming figures and central bank sentiment, particularly in light of persistent inflationary concerns across the Eurozone and potential Fed policy adjustments.
Price Action:
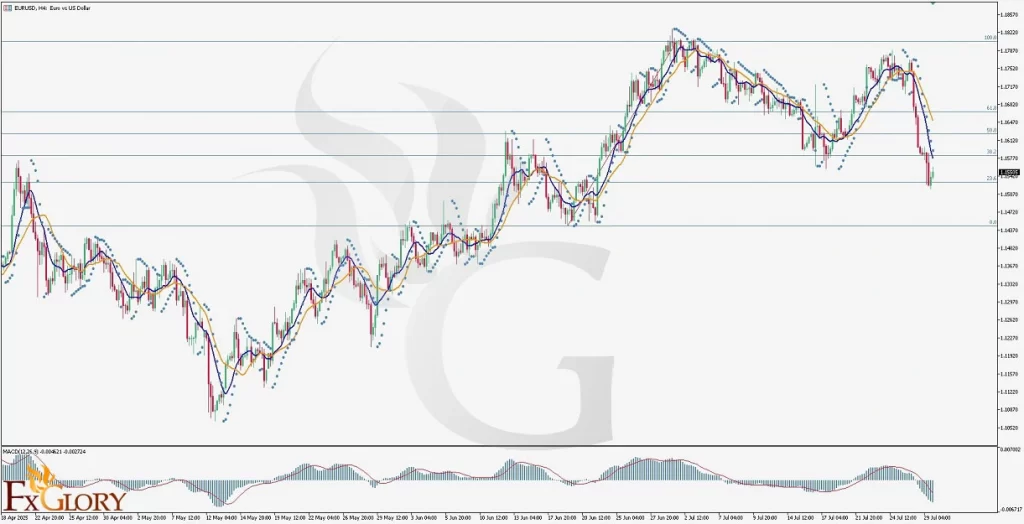
The EUR/USD pair on the H4 timeframe has initiated a sharp bearish correction from the 1.17300 peak, losing approximately -2.14% since the start of the week. After a strong downward move, price action found temporary support near the 23.6% Fibonacci retracement level at 1.15300. This has led to two green candles forming, suggesting a short-term rebound. However, the current downtrend structure remains dominant, with lower highs and lower lows evident. If the price fails to break through the resistance at the 38.2% (1.15820) or 50.0% (1.16250) retracement levels, a renewed decline could target the 0.0% Fibonacci level around 1.14500.
Key Technical Indicators:
Moving Averages: The 9-period EMA (blue) has decisively crossed below the 17-period EMA (orange), confirming the bearish shift in momentum on the EUR-USD H4 chart. This crossover early in the week has continued to guide price lower, acting as dynamic resistance during minor pullbacks.
Parabolic SAR: The Parabolic SAR dots are firmly positioned above the recent H4 candles, affirming bearish momentum. The indicator has been consistent in signaling downward price action and will remain a key reference point until a reversal signal forms below price.
MACD (Moving Average Convergence Divergence): The MACD histogram is strongly negative, with the MACD line at -0.004621 and the signal line at -0.002724. This widening gap suggests persistent downside pressure. However, traders should monitor for potential MACD convergence if upward corrective movement continues in the next few candles.
Support and Resistance:
Support: The key short-term support lies around the 1.15300 zone, coinciding with the 23.6% Fibonacci level. A break below this level could accelerate the move toward the 0.0% retracement near 1.14500.
Resistance: Immediate resistance stands at 1.15820 (38.2% Fib level). A further upside correction could face resistance at 1.16250 (50.0% Fib), with the stronger bearish barrier remaining around the 1.16700 region.
Conclusion and Consideration:
The EUR/USD H4 chart technical analysis signals a prevailing bearish bias, reinforced by the moving averages crossover, downward MACD momentum, and Parabolic SAR positioning. Although the pair shows a temporary bounce from 1.15300 support, any upward retracement toward the 38.2% or 50.0% Fibonacci levels may encounter renewed selling pressure. From a fundamental standpoint, key EUR economic data today may introduce volatility, but until significant bullish catalysts emerge, bears remain in control. Caution is advised for long positions unless confirmed by reversal signals.
Disclaimer: The analysis provided for EUR/USD is for informational purposes only and does not constitute investment advice. Traders are encouraged to perform their own analysis and research before making any trading decisions on EURUSD. Market conditions can change quickly, so staying informed with the latest data is essential.