Time Zone: GMT +3
Time Frame: 4 Hours (H4)
Fundamental Analysis:
Today, GBP-USD market sentiment is influenced by significant economic indicators from both the UK and US economies. The British Retail Consortium (BRC) Price Index data release today could lead to increased volatility in GBP pairs, especially ahead of tomorrow’s Bank of England monetary policy announcement. A stronger-than-forecast reading would positively impact GBP, as traders look for early signs of inflationary pressures. Conversely, the US Dollar will be impacted by the Census Bureau’s Trade Balance data and Wholesale Inventories figures, potentially influencing short-term USD demand. Market participants should closely monitor these releases for cues on the GBPUSD exchange rate movements.
Price Action:
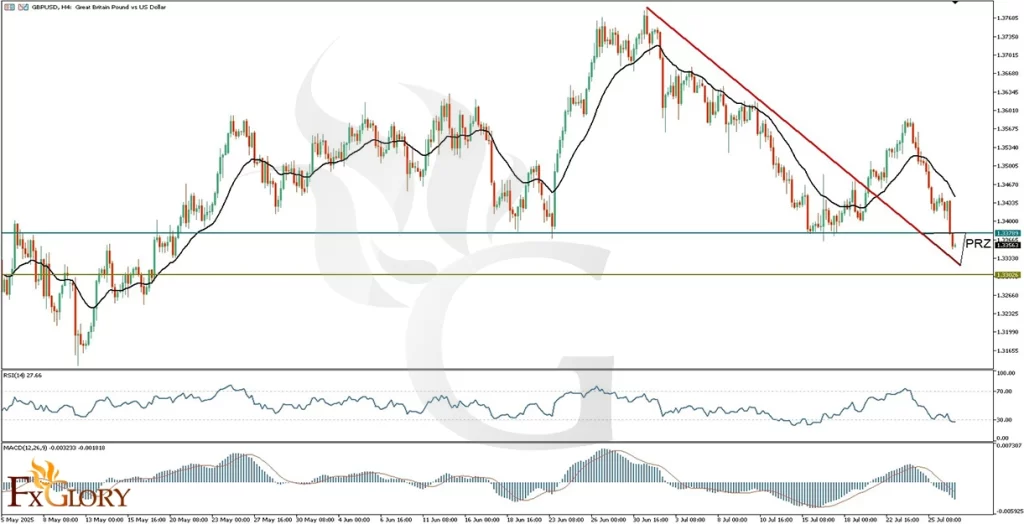
The GBP/USD H4 chart indicates the price has entered a Potential Reversal Zone (PRZ), identified between the broken support-turned-resistance around 1.33790 and the next significant support around 1.33020 derived from the latest cluster zone of candles. Price action traders are observing closely for signs of bullish reversal as the PRZ could act as a robust pivot area, potentially pushing prices upward towards the EMA21. However, if the PRZ fails to hold, a further bearish movement toward 1.33020 support is probable.
Key Technical Indicators:
EMA21: The GBPUSD pair price is currently below the EMA21 line, confirming a bearish short-term outlook. Traders might await a potential upward retest of the EMA21 for further bearish confirmation or reversal signals.
RSI (Relative Strength Index): The RSI stands at 27.66, signaling the market is in oversold conditions. This suggests a potential price reversal could occur soon, particularly given the RSI divergence observed in the H1 timeframe, enhancing the likelihood of a bullish correction.
MACD (Moving Average Convergence Divergence): The MACD indicator currently shows values of -0.0032 for the MACD line and -0.001818 for the signal line, indicating strong bearish momentum. Traders should monitor closely for potential bullish crossover signals in the coming sessions, signifying weakening bearish pressure.
Support and Resistance:
Support: Immediate and critical support is located at approximately 1.33020, corresponding with recent cluster lows.
Resistance: The nearest resistance level is now situated at around 1.33790, previously acting as significant support but currently broken and potentially acting as a resistance.
Conclusion and Consideration:
In conclusion, the GBP-USD pair on the H4 chart is currently in a critical reversal zone, supported by oversold RSI conditions, suggesting potential bullish reversal opportunities. The bearish momentum confirmed by EMA21 and MACD highlights caution for bullish entries. Traders should monitor today’s economic data closely, as market reactions could sharply influence GBP/USD volatility. Appropriate risk management strategies are highly recommended due to upcoming data-driven market uncertainties.
Disclaimer: The analysis provided for GBP/USD is for informational purposes only and does not constitute investment advice. Traders are encouraged to perform their own analysis and research before making any trading decisions on GBPUSD. Market conditions can change quickly, so staying informed with the latest data is essential.