Time Zone: GMT +3
Time Frame: 4 Hours (H4)
Fundamental Analysis:
BTC-USD price dynamics today could be influenced significantly by the USD economic data release from the Census Bureau regarding Durable Goods Orders and Core Durable Goods Orders (excluding transportation). Historically, stronger-than-expected data is supportive of the US Dollar, potentially applying downward pressure on BTCUSD prices. Traders should closely monitor today’s release, as robust economic data could trigger volatility, influencing both USD strength and risk appetite among cryptocurrency investors.
Price Action:
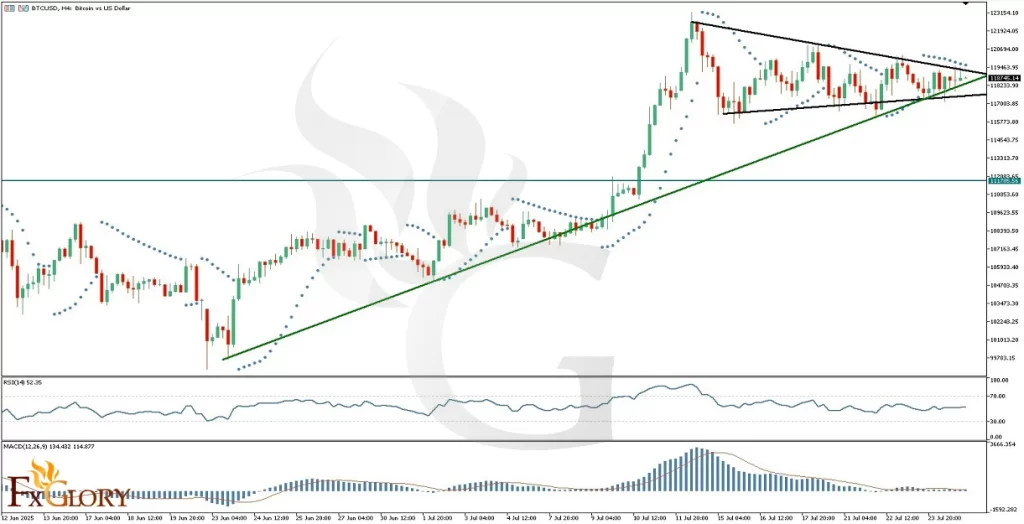
BTC USD analysis on the H4 chart shows the formation of a classic descending triangle following the recent All-Time High (ATH) around $123,000. This typically bearish formation signals potential downside risk and a possible correction toward the previous breakout level around $111,700. Currently, BTC vs. USD price action is testing a critical uptrend support line, presenting a pivotal decision point. Traders must monitor which trendline breaks first, as a decisive move could set the tone for the near-term BTCUSD direction.
Key Technical Indicators:
Parabolic SAR: The Parabolic SAR indicator is currently plotting dots above the recent candles, indicating a bearish sentiment in BTCUSD’s short-term price action. Traders may interpret this as a potential indication for continuation of the corrective move.
RSI (Relative Strength Index): RSI is currently around 52, situated near the midpoint, indicating neutral momentum in BTCUSD price. This positioning suggests that the market is undecided, making a breakout above or below current trendlines more impactful.
MACD (Moving Average Convergence Divergence): The MACD histogram and signal line are hovering around the zero level, signaling a neutral momentum for BTC-USD. This equilibrium indicates that market participants are awaiting stronger directional cues before committing.
Support and Resistance:
Support: The immediate and critical support lies at the ascending trendline around $118,200. A break below this could accelerate the move toward the major support at the previously broken resistance level near $111,700.
Resistance: Key resistance is located at the recent ATH around $123,000. A bullish breakout above this resistance could signal renewed upward momentum and target fresh highs.
Conclusion and Consideration:
BTC USD is at a critical juncture on the H4 chart, with significant uncertainty as indicated by neutral technical indicators like RSI and MACD. The bearish formation of the descending triangle is balanced by strong ascending trendline support. Today’s USD economic data, particularly Durable Goods Orders, may serve as a catalyst for volatility, and traders should carefully manage risk accordingly. It is prudent to wait for a confirmed breakout in either direction before initiating new positions.
Disclaimer: The analysis provided for BTC/USD is for informational purposes only and does not constitute investment advice. Traders are encouraged to perform their own analysis and research before making any trading decisions on BTCUSD. Market conditions can change quickly, so staying informed with the latest data is essential.