Time Zone: GMT +3
Time Frame: 4 Hours (H4)
Fundamental Analysis:
Gold (XAU/USD) traders should brace for volatility due to key economic indicators. The American Petroleum Institute (API) will release its weekly crude oil inventory report, with a smaller-than-expected drop in stockpiles possibly supporting gold prices by signaling a tightening supply. Additionally, the National Association of Realtors will publish monthly home sales data, where stronger-than-forecast results could boost sentiment and drive demand for gold as a safe haven. Traders will also watch the Energy Information Administration (EIA) report on crude inventories for signs of supply-demand imbalances, which could further influence gold prices.
Price Action:
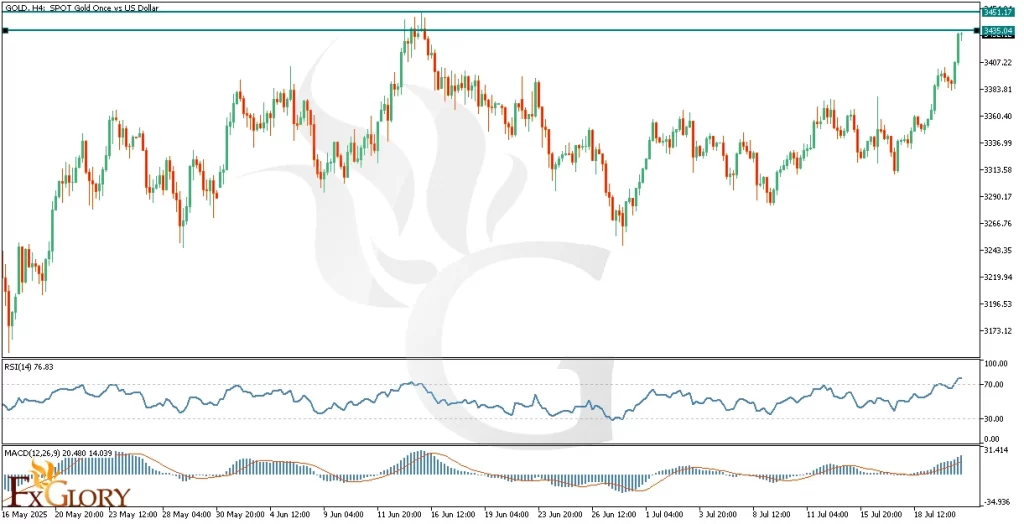
XAU/USD on the H4 chart is currently testing a significant resistance area, which has held price back in the past. The recent price action shows strong bullish momentum, and the pair is approaching this key resistance level with increasing buying pressure. If this resistance is broken, further upward movement is likely, as the market appears to be gaining strength. The RSI indicator is already in the overbought region, suggesting that momentum is on the side of buyers. If the resistance zone is successfully breached, the next target could be higher, driven by the continued bullish trend.
Key Technical Indicators:
RSI (Relative Strength Index): The RSI is currently at 76.83, in the overbought zone, signaling strong bullish momentum. Though approaching higher levels, it still has room for further upside before reaching extreme conditions, suggesting continued growth potential if resistance is broken.
MACD (Moving Average Convergence Divergence): The MACD shows strong bullish momentum, with the MACD line above the signal line and the histogram expanding. This indicates solid buying pressure, suggesting that further bullish movement is likely if the momentum continues.
Support and Resistance:
Support: Immediate technical support is found around the recent low levels near 3,173.12-3,176.25. A break below this zone could signal a potential retracement or correction in the price.
Resistance: Immediate resistance is observed at the recent high levels around 3,435.04-3,451.17, which aligns with significant price reaction points. A break above this resistance could lead to further bullish movement.
Conclusion and Consideration:
In conclusion, the analysis for XAU/USD (Gold) on the H4 chart suggests a bullish outlook, with further upside potential if key resistance levels are broken. Strong price action and momentum from the RSI and MACD support continued gains. However, traders should be mindful of volatility from key economic reports like the API crude oil inventory and EIA supply-demand updates. Immediate support is at 3,173.12-3,176.25, with resistance at 3,435.04-3,451.17. A break above resistance may fuel more bullish movement, while a decline below support could signal a retracement. Monitoring these levels is crucial for determining the next moves in gold.
Disclaimer: The analysis provided for XAU/USD is for informational purposes only and does not constitute investment advice. Traders are encouraged to perform their own analysis and research before making any trading decisions on XAUUSD. Market conditions can change quickly, so staying informed with the latest data is essential.