Time Zone: GMT +3
Time Frame: 4 Hours (H4)
Fundamental Analysis:
Today’s AUD/USD fundamental analysis points to significant drivers from both the AUD and USD sides. For the US Dollar, several key economic releases are due, including Retail Sales, Core Retail Sales, Initial Jobless Claims, and the Philadelphia Fed Business Outlook Survey, all of which are crucial for gauging US economic health and consumer spending. Speeches by various Federal Reserve officials, including FRBNY President John Williams, Federal Reserve Governor Adriana Kugler, and FRBSF President Mary Daly, will be closely monitored for clues on future monetary policy and potential interest rate adjustments, impacting USD strength. On the Australian Dollar front, the Melbourne Institute Consumer Inflation Expectations, Employment Change, and Unemployment Rate are primary indicators of Australian economic performance and labor market conditions. Additionally, both currencies will be influenced by the ongoing G20 meetings, where discussions on global economic issues could lead to policy shifts affecting the forex market.
Price Action:
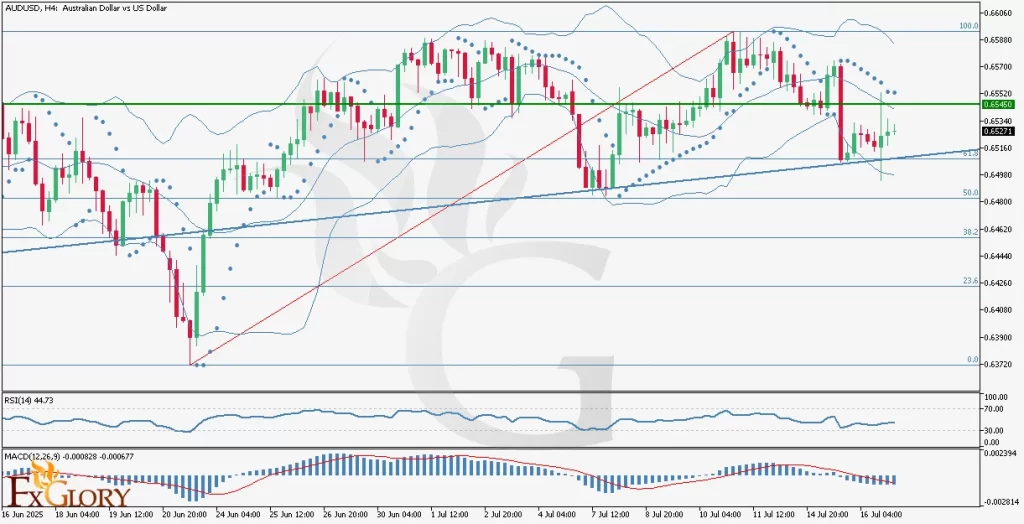
The AUD USD price action on the H4 timeframe reveals a slight long-term bullish trend that is currently undergoing a short-term correction. After repeatedly testing and being rejected by the 100.00 Fibonacci retracement level, which has acted as a strong resistance, the price has pulled back. However, a rebound appears to be underway from the 61.8 Fibonacci level, the lower Bollinger Band, and the long-term trend line. This is supported by the appearance of 5 green candles out of the last 8, indicating renewed buying interest and a potential move back towards the middle Bollinger Band, suggesting a bullish recovery in the short term.
Key Technical Indicators:
Bollinger Bands: The AUD-USD Bollinger Bands show the price currently interacting with the lower band, indicating a potential reversal from oversold conditions. With the price now showing signs of moving back towards the middle band, this suggests a return to the mean and a possible resumption of the underlying bullish momentum within the channel.
RSI (Relative Strength Index): The AUD-USD RSI is currently positioned at 44.73. This level indicates that the pair is not in overbought or oversold territory, providing room for potential upward movement without immediate concerns of an imminent reversal due to exhaustion.
MACD (Moving Average Convergence Divergence): The AUDUSD MACD histogram shows decreasing bearish momentum, with the MACD line potentially converging with or crossing above the signal line. This suggests that the selling pressure is easing, and a bullish crossover could be imminent, signaling a shift in favor of buyers.
Parabolic SAR: The AUD-USD Parabolic SAR, with a step of 0.05 and a maximum of 0.2, is currently placed above the recent candles. This indicates that the short-term trend is still considered bearish by this indicator, despite the recent green candles, suggesting that the bullish recovery is nascent and has not yet established strong momentum for a definitive trend reversal.
Support and Resistance:
Support: Immediate support is observed around the 0.65100 psychological level, which aligns with the 61.8 Fibonacci retracement and the lower Bollinger Band.
Resistance: Key resistance is found at the 0.65900 level, corresponding to the 100.00 Fibonacci retracement level, which has previously proven to be a significant barrier for AUDUSD price movements.
Conclusion and Consideration:
The AUDUSD technical analysis for H4 suggests that while the pair is undergoing a short-term correction after hitting a strong resistance, there are signs of a potential bullish rebound from key support levels. The confluence of the 61.8 Fibonacci level, the lower Bollinger Band, and the long-term trend line points to a buying opportunity for forex traders. However, the Parabolic SAR still indicates a short-term bearish bias, warranting caution. AUD USD traders should closely monitor the upcoming high-impact USD and AUD news events, particularly US retail sales data and Federal Reserve speeches, as these can significantly influence AUD/USD volatility and direction. Given the current market dynamics, a retest of the middle Bollinger Band seems plausible, but a clear break above the 100.00 Fibonacci level is needed to confirm a strong resumption of the long-term bullish trend for this currency pair.
Disclaimer: The analysis provided for AUD/USD is for informational purposes only and does not constitute investment advice. Traders are encouraged to perform their own analysis and research before making any trading decisions on AUDUSD. Market conditions can change quickly, so staying informed with the latest data is essential.