Time Zone: GMT +3
Time Frame: 4 Hours (H4)
Fundamental Analysis:
The GBP/USD currency pair is poised for potential volatility today as both UK and U.S. events are expected to influence market direction. In the morning, the Bank of England’s Financial Stability Report, along with the FPC Meeting Minutes and Statement, will offer insights into the central bank’s assessment of financial risks and its policy stance, potentially impacting the British pound. Additionally, the UK’s 10-year bond auction, with yields currently at 4.59%, may reveal investor appetite for gilts. On the U.S. side, attention turns to the Final Wholesale Inventories at 4:00 p.m., forecast at -0.2%, followed by Crude Oil Inventories at 4:30 p.m., with expectations of a 1.7 million barrel decline. These releases may influence inflation and growth expectations, thereby affecting the dollar. Later in the evening, the U.S. 10-year bond auction and the highly anticipated FOMC Meeting Minutes at 8:00 p.m. could provide key insights into the Fed’s interest rate outlook. Together, these events create a setup for notable movement in the GBP/USD pair throughout the day.
Price Action:
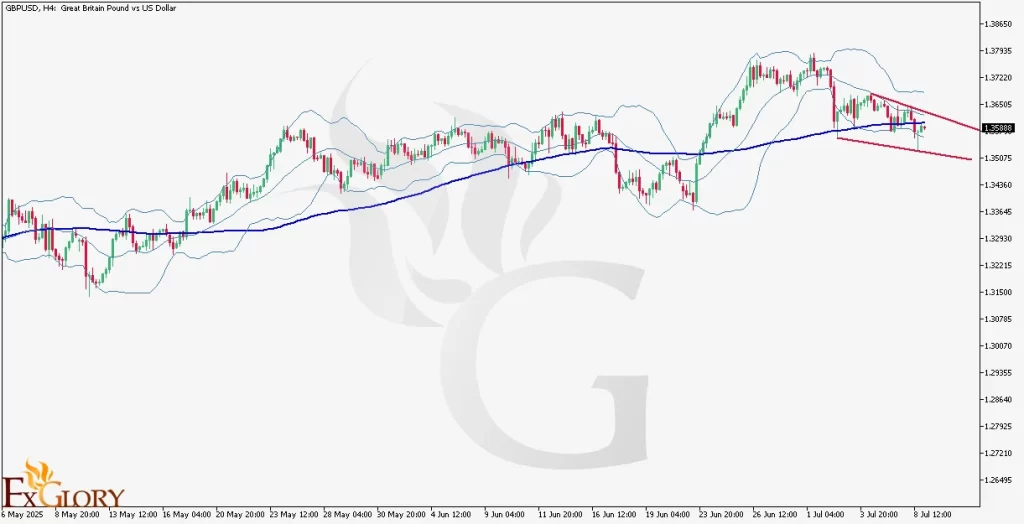
The GBP/USD on the H4 timeframe is currently showing a consolidation pattern within a descending triangle, following a prior uptrend. Price action is now trading just below the 100-period Moving Average (blue line), suggesting weakening bullish momentum and increasing bearish pressure. Bollinger Bands are narrowing, indicating reduced volatility and the potential for a breakout. The price is hovering near the triangle’s lower boundary, which could act as short-term support, but repeated tests of this level raise the risk of a breakdown. If the pair breaks below the lower trendline of the triangle with strong volume, a bearish continuation could follow, targeting lower support zones. Conversely, a breakout above the upper boundary and a move back above the 100-period MA could revive bullish momentum. Given the current technical structure, traders should closely watch for a decisive breakout, as the pair is approaching a key inflection point.
Key Technical Indicators:
Bollinger Bands: The price is trading between the middle and lower Bollinger Band, indicating growing bearish pressure. The bands are narrowing, suggesting reduced volatility and the potential for a breakout. A drop below the lower band may signal continued downside, while a bounce toward the middle band could face resistance.
100-period Moving Average (MA): The price is currently trading below the 100-period MA, indicating a bearish bias. This moving average now acts as dynamic resistance, and a break back above it would be required to shift sentiment toward bullish.
Support and Resistance Levels:
Support: The lower boundary of the descending triangle, located around 1.3540, acts as a key support level. This zone has been tested multiple times in recent sessions. A confirmed break below this support could open the way toward the next support zone around 1.3450, near previous consolidation and lower Bollinger Band levels.
Resistance: The upper boundary of the triangle, near 1.3625, is the immediate resistance. This level also aligns with the 100-period Moving Average, increasing its technical importance. A breakout above this resistance would shift short-term momentum to bullish, with the next upside target around 1.3700, where previous highs and the upper Bollinger Band align.
Conclusion and Consideration:
Given the current technical setup and the dense lineup of high-impact economic events from both the UK and the U.S., the GBP/USD pair is at a critical juncture. The descending triangle pattern on the H4 chart reflects market indecision, with price coiling between key support and resistance levels. Traders should prepare for a potential breakout in either direction, particularly as today’s fundamental releases—such as the FOMC Meeting Minutes and BOE communications—could act as catalysts for volatility. A break below 1.3540 may accelerate bearish momentum, while a push above 1.3625 and the 100-period MA could pave the way for a renewed bullish leg. As always, monitoring price behavior around these key levels in conjunction with incoming data will be essential for identifying the next directional move.
Disclaimer: The analysis provided for GBP/USD is for informational purposes only and does not constitute investment advice. Traders are encouraged to perform their own analysis and research before making any trading decisions on GBPUSD. Market conditions can change quickly, so staying informed with the latest data is essential.