Time Zone: GMT +3
Time Frame: 4 Hours (H4)
Fundamental Analysis:
The AUD/USD pair faces potential volatility driven by significant economic data releases. The National Australia Bank (NAB) Business Confidence Index, scheduled to be released soon, is a crucial indicator of Australia’s economic health. Positive results will likely strengthen the Australian Dollar. Simultaneously, the Reserve Bank of Australia’s (RBA) monetary policy decisions will significantly influence AUD sentiment. On the USD front, the NFIB Small Business Index and consumer credit data releases could create volatility, impacting the US Dollar’s strength and, consequently, the AUDUSD exchange rate.
Price Action:
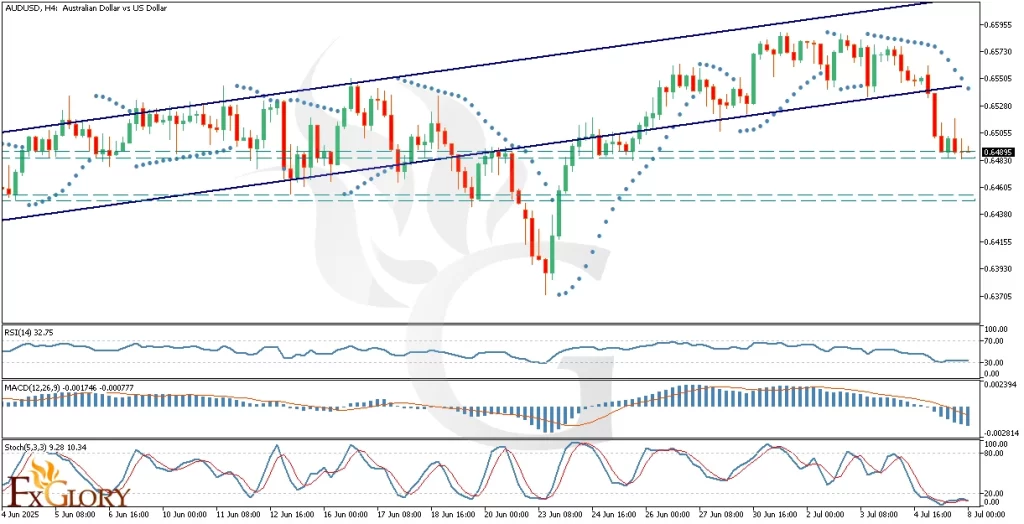
AUD-USD H4 timeframe currently illustrates an overall uptrend, recently disrupted by a break below the ascending channel’s lower boundary. The price action now tests a crucial support zone, exhibiting several doji candles that highlight market indecision and potential reversal signals. Should this support hold, we could anticipate a price retracement back to retest the broken channel boundary. Failure to sustain current levels may push AUDUSD towards the lower marked support zone.
Key Technical Indicators:
RSI (Relative Strength Index): RSI is currently at 32.75, near the oversold boundary of 30, indicating potential bullish correction in the near term. Traders should monitor closely for RSI recovery to signal a price rebound.
MACD (Moving Average Convergence Divergence): MACD histogram is showing increasing bearish momentum, with MACD line trending below the signal line, suggesting prevailing bearish pressure. A narrowing histogram in subsequent candles would be necessary to confirm any bullish reversal.
Stochastic Oscillator: The Stochastic Oscillator currently at 10.34, clearly in oversold territory, hints at an imminent upward price reversal. Traders should await a bullish crossover as a confirmation signal for entering long positions.
Parabolic SAR: The Parabolic SAR indicator is positioned above the current price candles, signaling continued bearish sentiment. Traders should watch for any shifts in the Parabolic SAR positioning below the price as a bullish reversal confirmation.
Support and Resistance:
Support: Immediate key support zone is around the 0.6480 level, acting as the critical pivot for near-term price action.
Resistance: The nearest resistance is around 0.6550, aligning with the recently broken ascending channel’s lower boundary.
Conclusion and Consideration:
The AUD USD H4 chart analysis suggests cautious bullish anticipation if current support holds, supported by oversold RSI and Stochastic indicators. Traders must closely monitor the NAB Business Confidence release and RBA’s statements for fundamental cues. The presence of doji candles at support underscores the potential for price reversal, while clear bearish MACD momentum calls for confirmation before establishing bullish positions. Investors should exercise caution given the upcoming USD economic releases that could significantly influence market dynamics.
Disclaimer: The analysis provided for AUD/USD is for informational purposes only and does not constitute investment advice. Traders are encouraged to perform their own analysis and research before making any trading decisions on AUDUSD. Market conditions can change quickly, so staying informed with the latest data is essential.