Time Zone: GMT +3
Time Frame: 4 Hours (H4)
Fundamental Analysis:
Bitcoin (BTC-USD) is showing resilience near its all-time high (ATH) amidst heightened macroeconomic attention. Today’s key USD news releases, including Non-Farm Payrolls, the Unemployment Rate, and Average Hourly Earnings, could introduce volatility for BTCUSD. If these releases indicate strong economic growth, the USD could strengthen, potentially pressuring BTC in the short term. However, persistent inflation and dovish Federal Reserve rhetoric continue to support long-term bullish sentiment toward crypto assets like Bitcoin. Traders are advised to watch closely as today’s U.S. labor data could fuel sudden shifts in risk appetite and BTC price momentum.
Price Action:
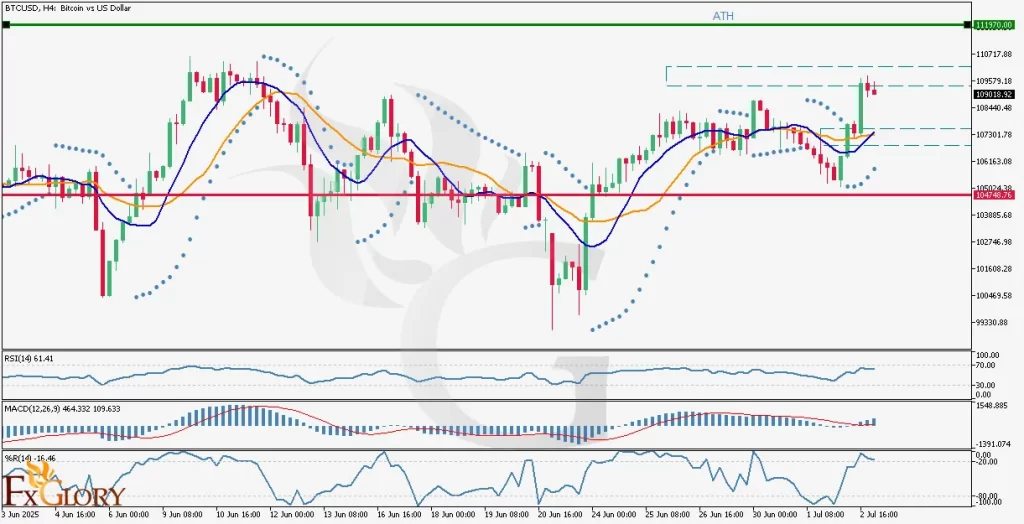
BTCUSD has approached the $109,000 level for the second time since recording its ATH at $111,970, suggesting strong bullish pressure but also visible resistance. The BTC/USD pair surged above $108,440, only to stall just before testing ATH again. Multiple long wicks near the resistance area reflect seller activity. However, the bullish structure remains intact with a clear higher low formed near $106,000. The repeated failure to breach the $109,000-$111,970 zone indicates a critical decision area. If bulls break this resistance convincingly, a new ATH may follow; otherwise, a pullback toward the lower support zone may occur.
Key Technical Indicators:
Parabolic SAR: The Parabolic SAR dots are currently positioned below the price candles, indicating a continuation of the bullish trend. This aligns with recent upward momentum and supports the possibility of further gains if resistance is broken.
Moving Averages (MA): The short-term MA 9 (blue) has crossed above the longer-term MA 17 (orange), signaling a bullish crossover. Although both moving averages are still below the latest candles, this crossover supports positive momentum. Sustained price above the MAs could signal further upside.
Relative Strength Index (RSI): The RSI stands at 61.41, which is bullish but not yet overbought. This suggests room for further upside before BTCUSD hits exhaustion levels. However, failure to push above 70 may indicate weakening bullish pressure near resistance.
MACD (12,26,9): The MACD line remains above the signal line, and the histogram is slightly positive. This reinforces bullish sentiment, although the gap is narrowing, which could signal a potential slowdown in momentum.
Williams %R: Currently at -16.46, this indicator shows BTCUSD is nearing overbought territory. Although it confirms recent bullishness, it also warns of a possible short-term pullback if buying pressure fades.
Support and Resistance:
Support: The key support zone lies around $106,500 – $107,300, where previous consolidation and moving average support align.
Resistance: Major resistance remains between $109,000 – $111,970, which includes the recent peak and the ATH barrier.
Conclusion and Consideration:
In this H4 BTCUSD technical and fundamental daily analysis, Bitcoin is consolidating just below its ATH after a strong upward move. Price action, combined with bullish signals from MA, Parabolic SAR, RSI, and MACD, supports the bullish outlook—but the cluster of resistance near the ATH demands caution. Today’s U.S. labor data could act as a catalyst for a breakout or reversal. Traders should monitor price behavior closely around $109K and adjust positions accordingly. Risk management is essential amid expected USD volatility.
Disclaimer: The analysis provided for BTC/USD is for informational purposes only and does not constitute investment advice. Traders are encouraged to perform their own analysis and research before making any trading decisions on BTCUSD. Market conditions can change quickly, so staying informed with the latest data is essential.