Time Zone: GMT +3
Time Frame: 4 Hours (H4)
Fundamental Analysis:
ETH-USD’s price dynamics today may be significantly influenced by USD economic data releases. Upcoming news includes the Producer Price Index (PPI), Core PPI, Initial Jobless Claims, Natural Gas Storage, and the results from the Treasury Auction. Positive figures, particularly from PPI and employment indicators, typically strengthen the USD and may pressure ETHUSD. Conversely, weaker-than-expected results could stimulate bullish sentiment towards Ethereum, as investors might shift toward cryptocurrencies as an alternative investment during USD uncertainty.
Price Action:
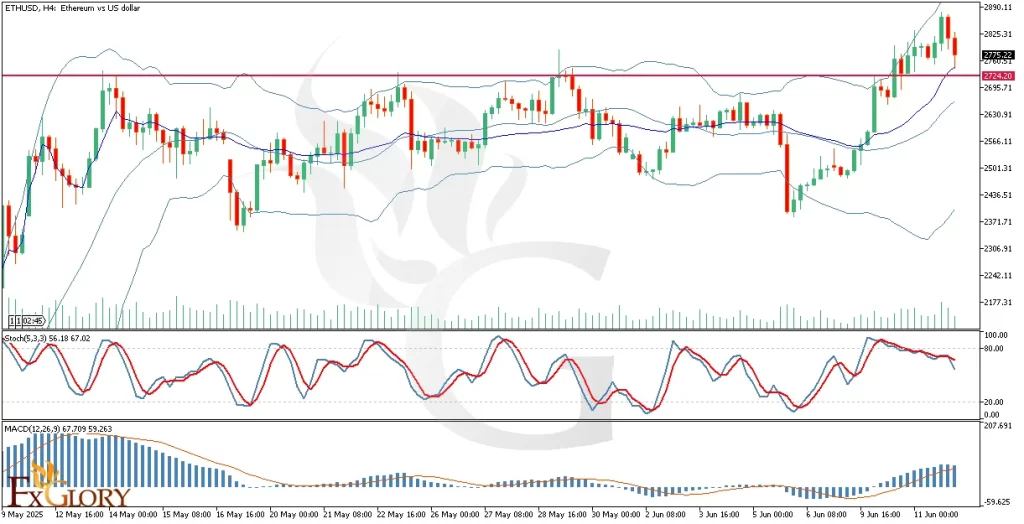
ETH/USD analysis on the H4 timeframe reveals a classic flag pattern, indicative of a bullish continuation scenario. Price has recently exited a period of sideways consolidation, decisively breaking above the upper Bollinger Band. The current candle has performed a textbook pullback, retesting the breakout level, signaling potential confirmation of renewed bullish momentum. If ETH Vs. USD sustains this breakout, a target equivalent to the flagpole height could be anticipated.
Key Technical Indicators:
Bollinger Bands: Bollinger Bands on the ETH USD chart have recently widened due to the upward breakout, highlighting increased volatility. After exceeding the upper band, the price retraced back towards the middle band, a common occurrence signaling a potential continuation in the trend once support is confirmed at this level.
Stochastic Oscillator: The stochastic oscillator currently reads at approximately 56, having turned down from overbought conditions. This reflects a short-term correction, aligning with the recent pullback. The oscillator indicates a neutral to slightly bullish momentum, pending confirmation from price action at key support.
MACD (Moving Average Convergence Divergence): The MACD histogram shows declining bullish momentum after a robust upward move. Although momentum is decreasing, the MACD line remains above the signal line, suggesting bullish momentum remains intact but cautioning traders to monitor closely for potential bearish crossovers.
Support and Resistance:
Support: Immediate support is situated near $2745, aligning with recent breakout levels and the middle Bollinger Band.
Resistance: Resistance is placed around the recent high of $2890, which ETHUSD must surpass to confirm sustained bullish sentiment.
Conclusion and Consideration:
Technical analysis of ETH/USD on the H4 chart strongly indicates potential bullish continuation, supported by price action and key technical indicators such as Bollinger Bands, MACD, and the Stochastic oscillator. However, traders must remain vigilant with today’s USD economic news, as positive results could introduce downward pressure. Always ensure risk management strategies are in place to mitigate potential volatility.
Disclaimer: The analysis provided for ETH/USD is for informational purposes only and does not constitute investment advice. Traders are encouraged to perform their own analysis and research before making any trading decisions on ETHUSD. Market conditions can change quickly, so staying informed with the latest data is essential.