Time Zone: GMT +3
Time Frame: 4 Hours (H4)
Fundamental Analysis:
Gold (XAU/USD) is likely to experience volatility today driven by upcoming key economic data from the US Census Bureau regarding Wholesale Inventories. Traders should closely monitor the release, as a lower-than-forecasted result usually strengthens the USD, negatively impacting Gold prices. Conversely, weaker inventory data might spur demand for safe-haven assets like Gold, offering support to bullish scenarios.
Price Action:
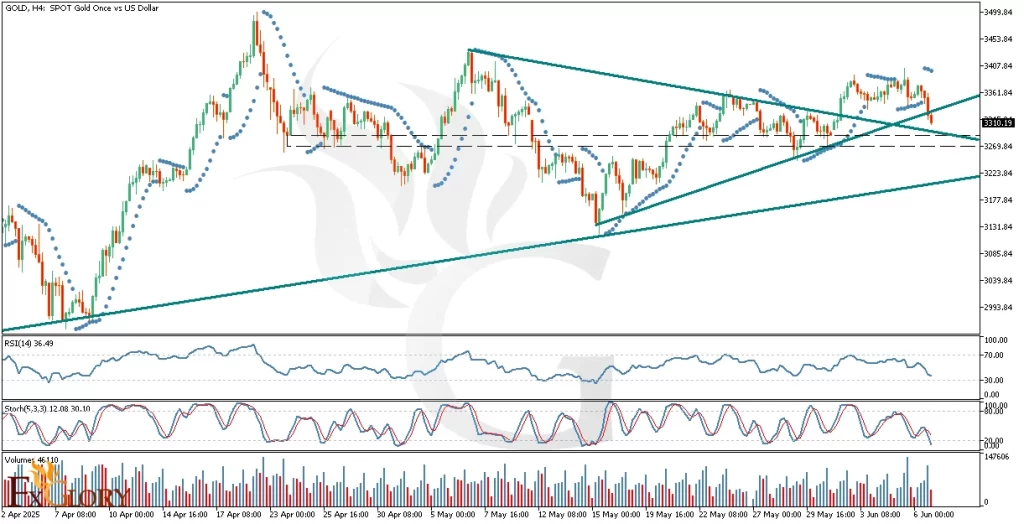
Analyzing the GOLD H4 chart, the price recently experienced a correction that broke the immediate ascending trendline with the last two bearish candles. However, the broader bullish sentiment remains strong, potentially signaling a Breakout Failure (BOF). The visible divergence between recent price lows and oscillators strengthens this view, suggesting the possibility of a bullish reversal soon. Should the price continue declining, further downside targets include the subsequent ascending trendline and immediate horizontal support levels.
Key Technical Indicators:
Parabolic SAR: Currently positioned above the price candles, suggesting a bearish sentiment short-term. A shift below candles would confirm renewed bullish momentum.
RSI: RSI stands at 36.49, approaching oversold territory. This indicates potential exhaustion of bearish momentum, implying a near-term reversal might occur.
Stochastic Oscillator: The stochastic indicator is approaching oversold levels, further highlighting potential bullish reversal opportunities soon, supported by oscillator-price divergence.
Volume: Recent bearish candles showed moderate volume, indicating sellers are present but not yet dominating strongly, adding caution to bearish continuation expectations.
Support and Resistance:
Support: Immediate key support at approximately 3296.84, followed by a more critical support level around 3269.84, aligning with previous consolidation zones.
Resistance: Significant resistance identified near 3361.84, a recent peak, and beyond that at approximately 3407.84, representing previous highs.
Conclusion and Consideration:
The H4 technical and fundamental chart daily analysis for GOLD indicates current bearish pressure but highlights robust underlying bullish strength. Traders should cautiously monitor price actions around immediate support zones for potential reversals. Today’s wholesale inventories data could be pivotal in defining short-term Gold price direction, emphasizing the importance of attentive risk management strategies.
Disclaimer: The analysis provided for XAU/USD is for informational purposes only and does not constitute investment advice. Traders are encouraged to perform their own analysis and research before making any trading decisions on XAUUSD. Market conditions can change quickly, so staying informed with the latest data is essential.