Time Zone: GMT +3
Time Frame: 4 Hours (H4)
Fundamental Analysis:
Today, the AUDUSD pair is set for a dynamic trading session amid mixed economic data and key events. Early in the Asian session, Australia’s GDP q/q figure is released, showing a modest 0.4% growth against an expected 0.6%, potentially weighing on the AUD. Meanwhile, the USD faces several critical reports and speeches that could drive volatility, including the ADP Non-Farm Employment Change, which came in stronger than forecast at 111K versus 62K, possibly boosting the greenback. FOMC members Bostic and Cook are also scheduled to speak, with market participants watching closely for any monetary policy signals. Later in the day, the USD Final Services PMI held steady at 52.3, while the ISM Services PMI rose to 52.0, above expectations, and Crude Oil Inventories showed a slight drawdown. The release of the Fed’s Beige Book in the evening will provide further insights into economic conditions, keeping USD traders alert. Overall, AUDUSD will likely react to a blend of Australian growth data and US employment and service sector reports.
Price Action:
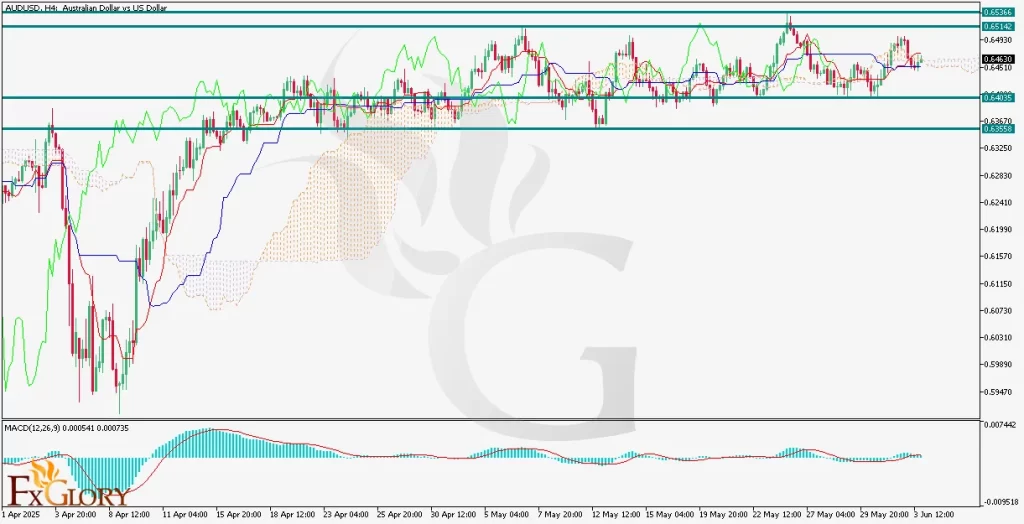
AUD/USD price action analysis on the H4 timeframe reveals a prolonged period of sideways consolidation between the resistance at approximately 0.65142 and support near 0.64035. The pair has tested these levels multiple times, showing indecision in the market. The Ichimoku Cloud indicates a mixed sentiment with price hovering around the Kijun-Sen (blue line) and Tenkan-Sen (red line), while the cloud itself is relatively flat, confirming the sideways trend. The MACD histogram shows minimal momentum with a close-to-zero reading, reflecting the lack of strong directional bias. A decisive break above the 0.65142 resistance could trigger a bullish move targeting the next resistance at 0.65366, whereas failure to break higher might see the pair retesting support levels around 0.64035 and possibly 0.63558.
Key Technical Indicators:
Ichimoku Cloud: The Ichimoku Cloud shows a flat and narrow formation, indicating consolidation and indecision in the AUD/USD market. The price is hovering around the Tenkan-Sen (red line) and Kijun-Sen (blue line), suggesting no clear trend direction. The cloud ahead is thin and slightly bullish, hinting at potential for a breakout but with cautious momentum.
MACD (Moving Average Convergence Divergence): The MACD histogram is close to the zero line with small bars, reflecting very weak momentum and a lack of strong directional bias. The MACD line and signal line are nearly converged, indicating the market is in a neutral state, and traders should watch for a clear crossover to signal a potential trend shift.
Support and Resistance:
Support: Immediate support at 0.64035, with further downside support levels at 0.63558 and a crucial support zone near 0.63300.
Resistance: Immediate resistance at 0.65142, followed by a higher resistance level at 0.65366.
Conclusion and Consideration:
In conclusion, the AUD/USD pair is poised for a cautious trading session influenced by mixed Australian GDP data and stronger-than-expected US employment figures, alongside key speeches and reports that could sway market sentiment. Technically, the pair remains in a consolidation phase with limited momentum, as reflected by the Ichimoku Cloud and MACD indicators, signaling indecision and a lack of clear direction. Traders should watch closely for a breakout above the 0.65142 resistance to confirm a bullish shift, or a breakdown below 0.64035 support that could open the way for further declines. Overall, the interplay of fundamental catalysts and technical consolidation suggests that volatility may increase, but clear directional cues are yet to emerge.
Disclaimer: The analysis provided for AUD/USD is for informational purposes only and does not constitute investment advice. Traders are encouraged to perform their own analysis and research before making any trading decisions on AUDUSD. Market conditions can change quickly, so staying informed with the latest data is essential.