Time Zone: GMT +3
Time Frame: 4 Hours (H4)
Fundamental Analysis:
Today, the USD is expected to experience significant volatility with multiple critical economic events and speeches. Federal Reserve speakers including Christopher Waller, Jerome Powell, Austan Goolsbee, and Lorie Logan are scheduled, potentially influencing USD through monetary policy hints. Additionally, key reports like the ISM Manufacturing PMI and Manufacturing Prices Paid Index will further affect the dollar’s strength. For Bitcoin (BTC), the absence of specific events means it will largely follow technical cues and market sentiment impacted indirectly by USD movements.
Price Action:
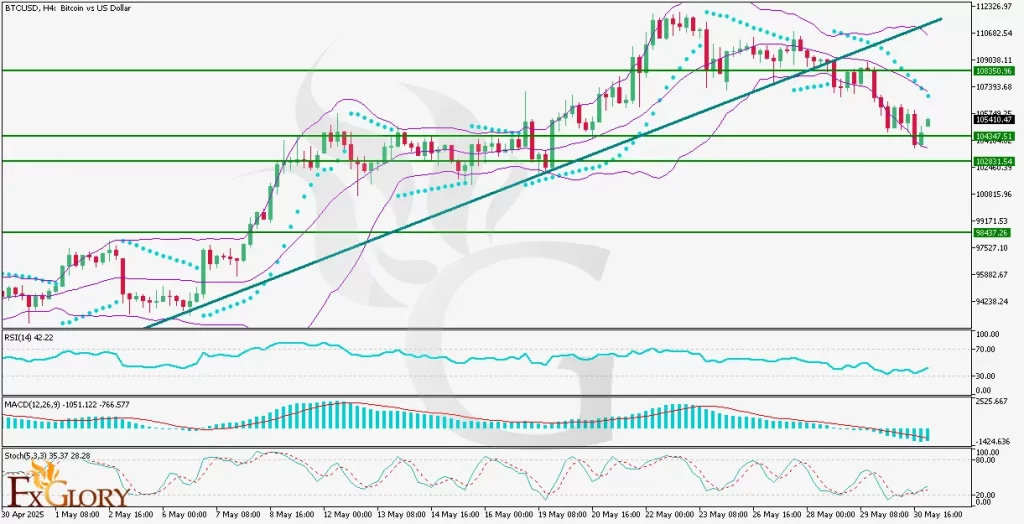
BTC/USD price action analysis on the H4 timeframe shows a clear correction from its recent All-Time High (ATH). After failing at the first support level, BTC found support near the 104347 level, indicated by two recent bullish candles. Despite this support, BTCUSD remains vulnerable to further downside, with potential tests at 102830 and subsequently 98437. The observable divergence between price and oscillators highlights potential weakening in the current bullish momentum, warranting caution.
Key Technical Indicators:
Bollinger Bands: The Bollinger Bands have widened, reflecting increased volatility in BTC-USD. Price recently touched the lower band, signaling a possible short-term reversal or pause in the bearish correction.
Parabolic SAR: The indicator is bearish, with dots positioned above the current price candles, signifying a dominant bearish momentum in BTCUSD. Traders should monitor for a shift of dots below candles for potential bullish signals.
RSI (Relative Strength Index): The RSI at 42.22 is in neutral territory but leaning bearish, suggesting potential further downside in BTCUSD, although not yet oversold, leaving room for additional price declines.
MACD (Moving Average Convergence Divergence): The MACD histogram shows decreasing bearish momentum, with bars shortening, indicating a possible weakening in selling pressure. Traders should watch for a bullish crossover as a reversal signal.
Stochastic Oscillator: Currently at 35.37, the Stochastic Oscillator indicates bearishness, not yet oversold, suggesting possible continuation downward before any meaningful bullish reversal occurs.
Support and Resistance:
Support: Immediate support at 104347, further downside supports at 102830 and crucial support at 98437.
Resistance: Immediate resistance at 105410, followed by 108530, with stronger resistance around 109308.
Conclusion and Consideration:
The BTC-USD pair on the H4 timeframe indicates continued bearish pressure amid recent correction dynamics from its ATH. Although technical indicators like MACD and RSI suggest weakening bearish momentum, key supports remain critical to watch closely. Traders should prepare for heightened volatility driven by today’s extensive USD economic news and Federal Reserve speeches. Caution is advised due to possible sudden market shifts influenced by macroeconomic developments.
Disclaimer: The analysis provided for BTC/USD is for informational purposes only and does not constitute investment advice. Traders are encouraged to perform their own analysis and research before making any trading decisions on BTCUSD. Market conditions can change quickly, so staying informed with the latest data is essential.