Time Zone: GMT +3
Time Frame: 4 Hours (H4)
Fundamental Analysis:
The EURUSD currency pair reflects market dynamics between the Euro (EUR) and the US Dollar (USD). Today, notable volatility is expected due to key economic data and speeches impacting both currencies. For the USD, significant events include speeches from FOMC members Mary Daly, Lorie Logan, and Raphael Bostic, along with critical economic releases like Core PCE Price Index, Personal Income, and the University of Michigan Consumer Sentiment report. For EUR, traders will closely monitor German and Eurozone CPI data and Retail Sales reports, which are essential indicators influencing monetary policy and inflation expectations.
Price Action:
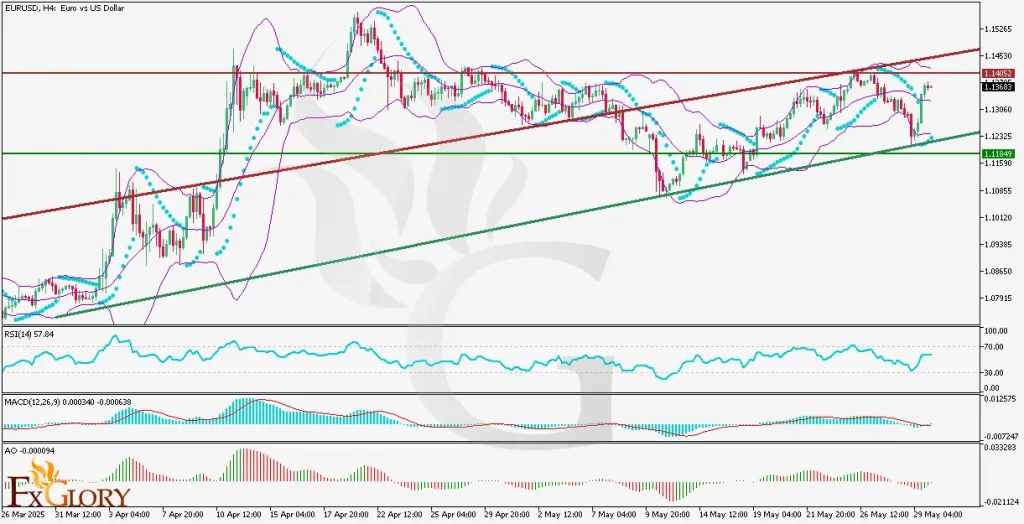
EUR-USD price action analysis on the H4 timeframe shows bullish momentum. Recently, the EURUSD broke and successfully retested a crucial resistance level, now acting as support, signaling bullish continuation potential. Currently, the price is heading towards the next resistance level at 1.14052. If this resistance is breached convincingly, the price action may target the upper resistance trend line, enhancing bullish sentiment further.
Key Technical Indicators:
Bollinger Bands: Bollinger Bands show expanding volatility with the price currently trading near the upper band, indicating strong bullish momentum. Continued trading near the upper band suggests potential upward continuation but also calls for vigilance for potential short-term corrections.
Parabolic SAR: The Parabolic SAR indicator is below the price bars, confirming the bullish trend. It indicates continued bullish sentiment until the dots reverse position above the price.
RSI (Relative Strength Index): The RSI indicator is at 58.22, suggesting moderate bullish momentum without being in the overbought territory. There is room for further upside movement, supporting a potential rise toward resistance.
MACD (Moving Average Convergence Divergence): MACD histogram is positive and recently crossed above the signal line, confirming bullish momentum. This indicator suggests increased buying pressure, reinforcing bullish sentiment in the short term.
Awesome Oscillator: The Awesome Oscillator has recently shifted to a small positive value, highlighting a bullish reversal from previous bearish momentum. The oscillator supports current bullish price action, though continued monitoring is essential for confirmation.
Support and Resistance:
Support: Immediate support is located at 1.11849, which aligns with the recently retested significant support.
Resistance: The nearest resistance level is at 1.14052, which coincides with key horizontal resistance and recent price action highs.
Conclusion and Consideration:
The EURUSD H4 analysis indicates a bullish bias supported by technical indicators and confirmed by recent price action. Traders should monitor closely upcoming US and EU economic data and speeches, which could significantly affect volatility and the EURUSD pair’s trajectory. A break above 1.14052 may trigger further bullish momentum, aiming towards the upper resistance trend line. Traders should manage risk carefully due to potential volatility from today’s news events.
Disclaimer: The analysis provided for EUR/USD is for informational purposes only and does not constitute investment advice. Traders are encouraged to perform their own analysis and research before making any trading decisions on EURUSD. Market conditions can change quickly, so staying informed with the latest data is essential.