Time Zone: GMT +3
Time Frame: 4 Hours (H4)
Fundamental Analysis:
Today’s GBPUSD pair is expected to see heightened volatility due to key events in both the UK and US. GBP is likely to react significantly to speeches by BOE Governor Andrew Bailey and BOE Deputy Governor Sarah Breeden, who may offer clues about future interest rate decisions. Meanwhile, the USD faces multiple key economic releases, including GDP data, initial jobless claims, and speeches by Federal Reserve members Austan Goolsbee and Adriana Kugler, which could heavily influence USD valuation through shifts in monetary policy expectations and economic outlook.
Price Action:
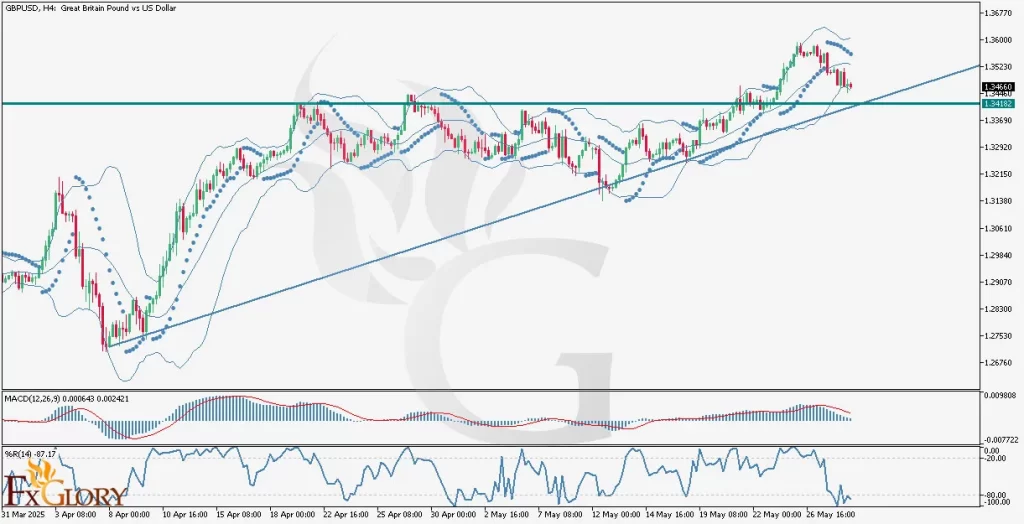
On the GBPUSD H4 chart, the pair maintains a bullish long-term trend but has recently retraced after touching the upper Bollinger Band, now approaching the lower band. Current candlestick formations suggest short-term bearish momentum, reinforced by the Parabolic SAR dots positioned above the candles, indicating selling pressure. Traders should watch closely for potential reversals near key support levels.
Key Technical Indicators:
Bollinger Bands: GBP/USD recently touched the upper band and has swiftly reversed to test the lower band, signaling possible short-term bearish consolidation. Traders might anticipate volatility and potential rebounds from the lower Bollinger Band.
Parabolic SAR: The Parabolic SAR dots are currently placed above the candles, clearly signaling a bearish sentiment in the short term. Traders should consider this indication for potential continuation of downward momentum until a reversal occurs.
MACD (Moving Average Convergence Divergence): The MACD histogram is declining, indicating waning bullish momentum and a potential bearish crossover. This suggests that the selling pressure may increase in the near term, prompting traders to prepare for potential downward moves.
Williams %R: Currently at -87.17, Williams %R indicates an oversold condition. This oversold level typically hints at a potential upcoming reversal or at least a temporary bullish correction, advising caution for short traders.
Support and Resistance:
Support: Immediate support for GBP USD is located around the 1.3430 area, coinciding with the lower Bollinger Band and ascending trendline.
Resistance: The nearest resistance is observed at approximately 1.3485, aligning with recent price highs and the previous breakout level.
Conclusion and Consideration:
Technical indicators on the GBP-USD H4 chart currently reflect short-term bearish sentiment within a broader bullish trend. The market’s response to today’s key economic announcements and central bank speeches will be critical in determining the pair’s next directional move. Traders should exercise caution due to expected volatility around the announcements.
Disclaimer: The analysis provided for GBP/USD is for informational purposes only and does not constitute investment advice. Traders are encouraged to perform their own analysis and research before making any trading decisions on GBPUSD. Market conditions can change quickly, so staying informed with the latest data is essential.