Time Zone: GMT +3
Time Frame: 4 Hours (H4)
Fundamental Analysis:
The BTCUSD pair reached an impressive new all-time high above $109,800 on Wednesday, surpassing its previous ATH of $109,588 set earlier this year on January 20. The bullish momentum remains intact with Bitcoin now targeting the psychological level of $120,000. Today’s economic calendar is dominated by the G7 meetings in Alberta, Canada, where finance ministers and central bankers will discuss crucial topics such as global economic outlook, AI innovations, and geopolitical tensions in Ukraine. Additionally, market participants will closely monitor the U.S. unemployment claims and S&P Global PMI reports for fresh insights into the health of the U.S. economy, which could indirectly influence BTC/USD price dynamics through USD valuation.
Price Action:
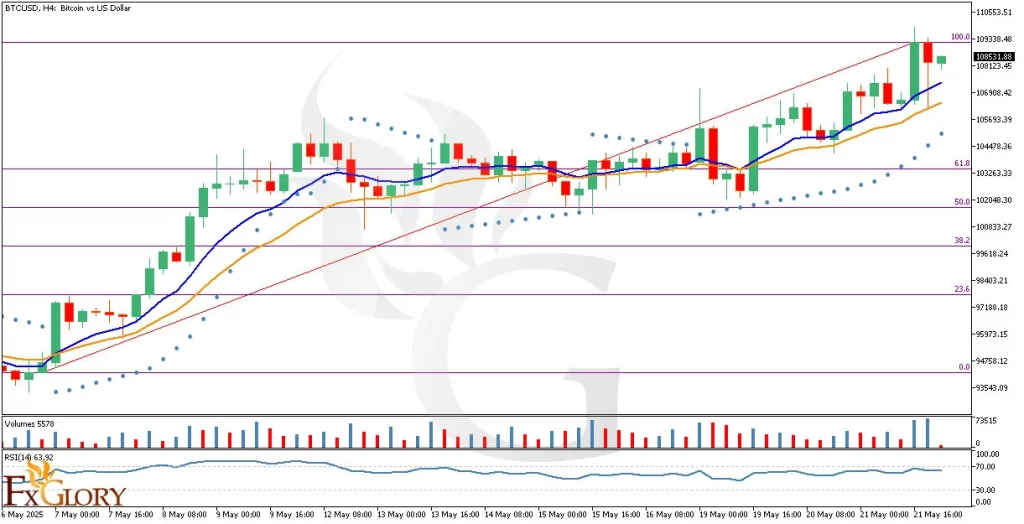
BTCUSD analysis on the H4 timeframe shows a bullish trend continuation after the MA9 (blue short-term moving average) crossed above the MA17 (orange long-term moving average), confirming bullish momentum. Price action indicates strong buyer presence, consistently forming higher highs and higher lows. The latest candles maintain bullish sentiment, reinforcing expectations of further upside potential as Bitcoin moves towards the next target near $120,000.
Key Technical Indicators:
Moving Averages (MA9 & MA17): The short-term MA9 crossing above the longer-term MA17 signals strong bullish momentum. The Bitcoin price is comfortably above both moving averages, suggesting ongoing bullish sentiment with potential for continued upward movement.
Parabolic SAR: The indicator shows bullish sentiment with dots positioned below the BTC price candles, supporting the ongoing upward trend and providing potential trailing stops for bullish positions.
Volumes: Trading volumes have notably increased, especially during upward movements, indicating strong market participation supporting the bullish scenario. Consistent buying volume reinforces bullish conviction.
Relative Strength Index (RSI): Currently, RSI stands at 63.92, below the overbought threshold of 70, indicating further room for upward momentum before reaching overextended conditions. RSI thus supports continued bullish sentiment.
Support and Resistance:
Support: Immediate support is located at the 61.8% Fibonacci retracement level around $103,263, coinciding with recent price consolidation areas.
Resistance: The nearest significant resistance is the current ATH at approximately $109,800, followed by psychological resistance at $120,000, which will be the next key bullish target.
Conclusion and Consideration:
BTCUSD remains strongly bullish on the H4 timeframe, supported by positive MA crossover, bullish Parabolic SAR positioning, rising volumes, and favorable RSI readings. However, traders should remain cautious and monitor today’s key economic indicators from the U.S. and G7 developments, as these events could induce short-term volatility in BTC USD price action. The next significant bullish objective remains the $120,000 mark, pending sustained buying volume and supportive fundamental conditions.
Disclaimer: The analysis provided for BTC/USD is for informational purposes only and does not constitute investment advice. Traders are encouraged to perform their own analysis and research before making any trading decisions on BTCUSD. Market conditions can change quickly, so staying informed with the latest data is essential.