Time Zone: GMT +3
Time Frame: 4 Hours (H4)
Fundamental Analysis:
Today, market participants are closely monitoring the Canadian CPI (Consumer Price Index) data release, a critical inflation indicator expected to influence the Canadian Dollar significantly. Higher-than-forecast CPI figures usually strengthen the CAD, reflecting potential rate hikes by the Bank of Canada aimed at combating inflation. Additionally, several Federal Reserve members, including Barkin, Bostic, and Musalem, are scheduled to speak. Hawkish remarks from these members could potentially bolster the USD by signaling tighter monetary policy ahead.
Price Action:
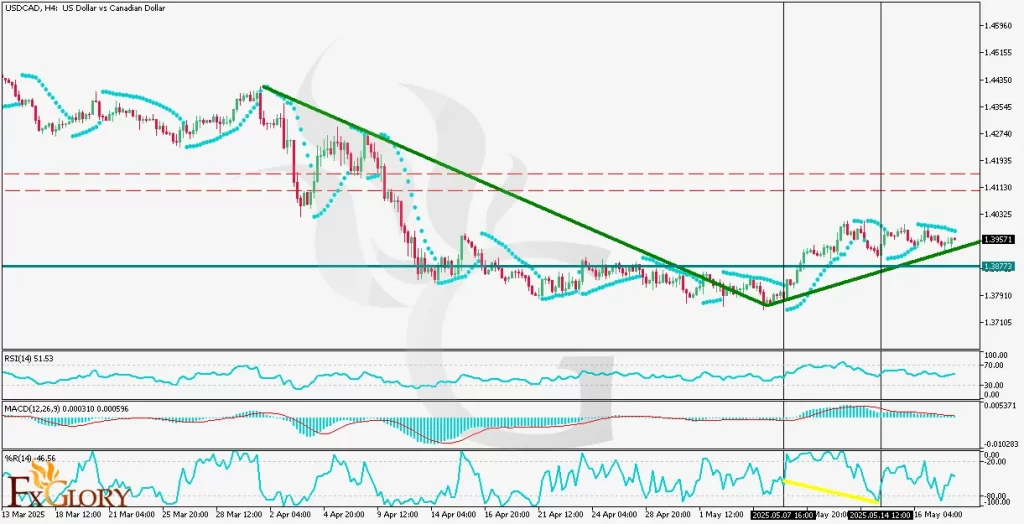
The USD-CAD currency pair on the H4 chart has recently initiated an upward trend after forming a noticeable bottom. The pair is approaching a critical resistance zone, and given its recent momentum, it may encounter difficulty surpassing this level on its initial attempt. Notably, a bullish divergence is observed between the price and RSI lows, suggesting underlying bullish strength. The current price rests on a supportive ascending trend line, reinforcing potential continuation of the upward movement.
Key Technical Indicators:
Parabolic SAR: The Parabolic SAR indicator currently shows bullish momentum, with dots positioned below the price bars, affirming continued buying interest and upward potential.
RSI (Relative Strength Index): The RSI value stands at 51.53, indicating a neutral market condition. However, a visible bullish divergence between price lows and RSI lows highlights increasing upward momentum, which supports the bullish scenario.
MACD (Moving Average Convergence Divergence): The MACD histogram reflects decreasing bullish momentum, suggesting caution. Although still above zero, the potential for a bearish crossover should be closely monitored, signaling a possible short-term reversal or consolidation.
Williams %R: The Williams %R indicator is at -46.56, indicating balanced market conditions without clear overbought or oversold signals. However, it confirms the upward trajectory with room for further price advancement before reaching an overbought scenario.
Support and Resistance:
Support: Immediate support is located at 1.38723, aligning with the current ascending support trend line and recent price consolidation.
Resistance: The nearest resistance level is at 1.40250-1.41000, coinciding with historical highs and significant selling interest.
Conclusion and Consideration:
The USDCAD H4 analysis suggests an ongoing bullish bias, supported by technical indicators and recent price action behavior. While immediate resistance could temporarily hinder the bullish movement, underlying momentum indicators, notably the RSI divergence, favor an eventual upward breakout. Traders should cautiously watch today’s Canadian CPI data and Fed members’ speeches for significant volatility that could rapidly shift market sentiment and affect the USD/CAD price action.
Disclaimer: The analysis provided for USD/CAD is for informational purposes only and does not constitute investment advice. Traders are encouraged to perform their own analysis and research before making any trading decisions on USDCAD. Market conditions can change quickly, so staying informed with the latest data is essential.