Time Zone: GMT +3
Time Frame: 4 Hours (H4)
Fundamental Analysis:
GBPAUD is in focus today as markets react to significant economic releases from both the UK and Australia. From the GBP perspective, preliminary GDP figures came in stronger than expected at 0.6% quarter-on-quarter, outperforming forecasts of 0.1%. Manufacturing production and industrial output, however, missed expectations, declining by 0.8% and 0.6%, respectively. Despite a slightly wider goods trade deficit of -£19.7B, improvements in construction output and services index provided mixed signals for the UK economy. On the Australian side, employment data showed robust job growth, adding 20.9K positions against an anticipated 32.2K, with the unemployment rate holding steady at 4.1%. Traders will closely monitor how these mixed data points influence GBPAUD’s direction, watching for potential shifts in sentiment or confirmation of the pair’s near-term momentum.
Price Action:
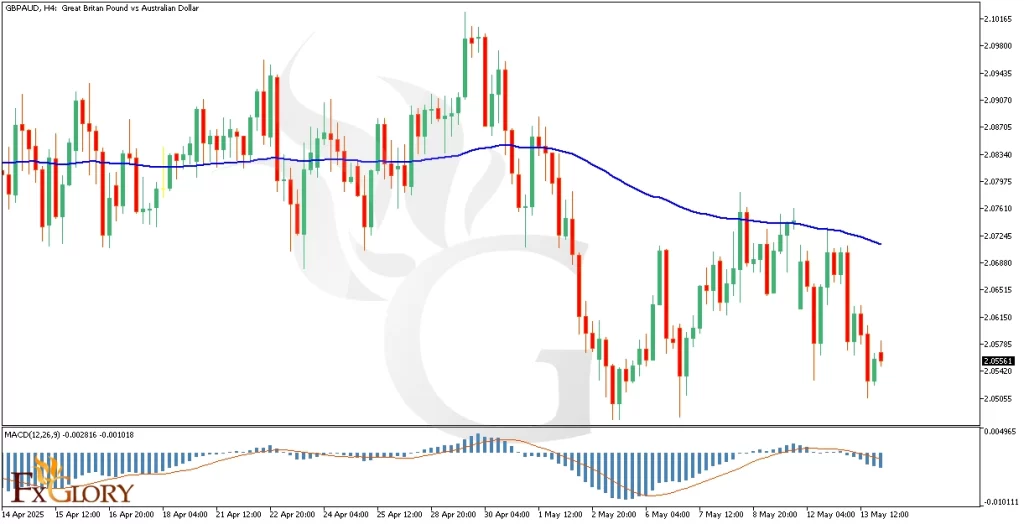
The GBPAUD pair on the H4 timeframe has recently shifted to a bearish structure, evidenced by the clear break and sustained movement below the 200-period moving average. The recent series of strong bearish candles highlights increased selling pressure, suggesting market sentiment has turned negative. This downward move follows an extended phase of consolidation around the moving average, indicating that sellers have gained decisive control. If the price continues to sustain this bearish momentum and clearly breaks below recent support levels, it could lead to further declines and solidify the bearish trend.
Key Technical Indicators:
100-period Moving Average (MA100): The GBPAUD price is currently trading below the 100-period moving average (blue line), confirming that the overall market sentiment remains bearish. This moving average has acted consistently as dynamic resistance, suppressing bullish attempts and reinforcing downward momentum. A sustained break above this moving average would signal a weakening of bearish control and potentially mark the beginning of a bullish reversal.
MACD Indicator: The MACD histogram remains below the zero line, signaling ongoing bearish momentum. However, the histogram bars have begun to shorten, indicating a possible weakening in bearish strength and hinting at the potential for a bullish crossover. Traders should closely watch the MACD line for any bullish crossover above the signal line, as this could further validate a potential reversal scenario.
Support and Resistance:
Support: The nearest resistance lies near 2.06880, aligned with the 100-period moving average, which continues to act as a dynamic ceiling. A clear break above this could lead the price toward the next key resistance zone around 2.07600.
Resistance: The nearest resistance lies near 2.06880, aligned with the 100-period moving average, which continues to act as a dynamic ceiling. A clear break above this could lead the price toward the next key resistance zone around 2.07600.
Conclusion and Consideration:
In conclusion, the GBPAUD pair is currently facing bearish pressure both technically and fundamentally. Despite better-than-expected UK GDP figures, mixed economic signals and robust employment data from Australia create uncertainty regarding future direction. Technically, price action confirms increased selling momentum with key moving averages acting as resistance, and MACD indicating potential for bearish momentum to weaken. Traders should closely monitor the pair’s reaction near critical support at 2.05650 and resistance around 2.06880 for clear directional cues, which could either confirm a continuation of the bearish trend or signal a possible bullish reversal.
Disclaimer: The analysis provided for GBP/AUD is for informational purposes only and does not constitute investment advice. Traders are encouraged to perform their own analysis and research before making any trading decisions on GBPAUD Market conditions can change quickly, so staying informed with the latest data is essential.


