Time Zone: GMT +3
Time Frame: 4 Hours (H4)
Fundamental Analysis:
Today, BTCUSD’s price action is closely influenced by upcoming economic releases from the United States, including the NFIB Small Business Index and Core CPI data. A higher-than-expected NFIB Small Business Index could strengthen the USD, placing downward pressure on BTCUSD. Meanwhile, market participants keenly await the Consumer Price Index (CPI) data, given its critical impact on inflation expectations and potential Federal Reserve actions. A higher CPI reading may boost USD strength, potentially pressuring BTC downward.
Price Action:
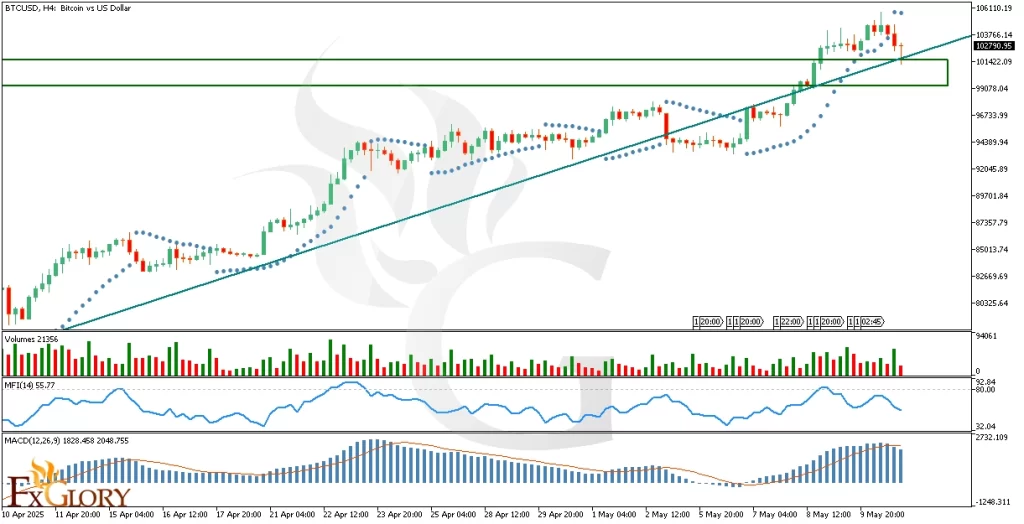
BTC-USD analysis on the H4 timeframe continues to display an uptrend, currently undergoing a correction phase. Recently, BTCUSD reached a strong support zone evidenced by a confluence of the horizontal support level and ascending trend line. The formation of a doji candle at this support zone indicates market indecision, highlighting the critical nature of this technical level. Traders should closely monitor subsequent candles to confirm price direction.
Key Technical Indicators:
Volume: Volume indicators suggest moderate trading activity. While volume decreased slightly during the latest corrective candles, a spike in buying volume near current support would significantly reinforce bullish sentiment, confirming potential reversal points.
Parabolic SAR: Currently, the Parabolic SAR dots are positioned above the price action, suggesting short-term bearish pressure. However, their proximity to price action hints that a reversal may be imminent should the price stabilize and rise from the support zone.
MFI (Money Flow Index): The MFI currently stands at 55.77, indicating balanced market participation with room for further buying or selling pressure. It suggests neither overbought nor oversold conditions, supporting the potential for price stabilization and subsequent bullish momentum from the current support zone.
MACD (Moving Average Convergence Divergence): The MACD histogram shows a diminishing bullish momentum, indicating a weakening uptrend in the short term. Traders should watch for a bullish crossover of the MACD and signal line to validate potential upward continuation.
Support and Resistance:
Support: Immediate support is identified at $10142.09–$10279.95, strengthened by a historical consolidation area and the ascending trend line.
Resistance: The immediate resistance levels to watch are around the recent high near $105786.14, with further resistance observed at historical peaks above this area.
Conclusion and Consideration:
BTCUSD on the H4 chart currently shows a corrective phase within an overall bullish trend, supported by key indicators like Volume, Parabolic SAR, MFI, and MACD. Today’s significant economic data releases from the U.S. pose potential volatility, likely affecting BTC USD movements sharply. Traders should cautiously observe the critical support zone at current levels for potential reversal signals, while maintaining awareness of U.S. economic indicators which could heavily influence the BTCUSD pair.
Disclaimer: The analysis provided for BTC/USD is for informational purposes only and does not constitute investment advice. Traders are encouraged to perform their own analysis and research before making any trading decisions on BTCUSD Market conditions can change quickly, so staying informed with the latest data is essential.