Time Zone: GMT +3
Time Frame: 4 Hours (H4)
Fundamental Analysis:
The EUR/USD currency pair is experiencing moderate volatility today due to significant economic events affecting both the Euro and the US Dollar. The US Dollar’s strength could see fluctuations with speeches from Federal Reserve officials, notably Richmond Fed President Thomas Barkin and Fed Governor Adriana Kugler. Their remarks could deliver insights into future interest rate adjustments and monetary policy stances. Additionally, the US Monthly Treasury Statement, providing the government’s income and expenditure balance, might influence USD stability. Meanwhile, Eurozone traders will closely follow announcements from the Eurogroup meeting regarding financial policies and euro area economic outlooks.
Price Action:
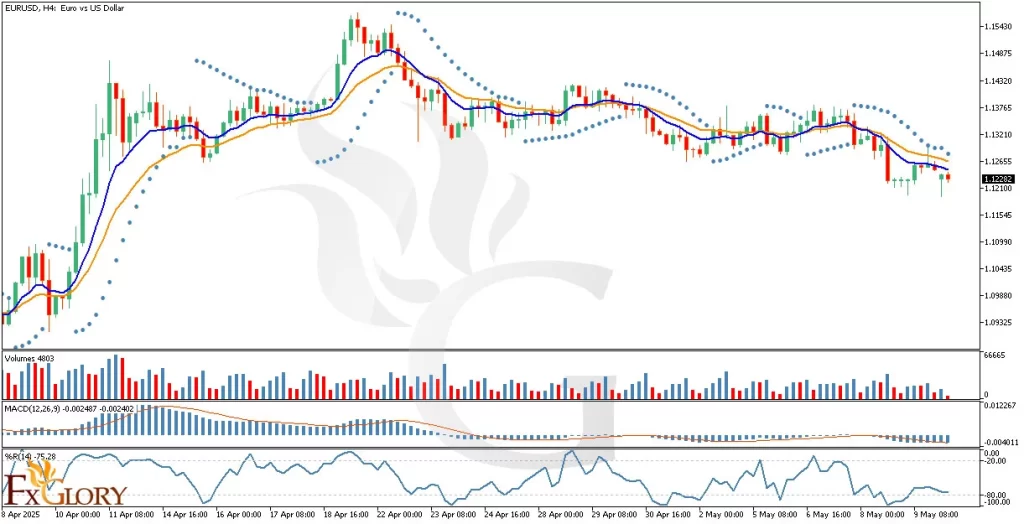
The EUR-USD H4 chart analysis indicates a bearish price action trend. Price has clearly transitioned into a bearish momentum, confirmed by lower highs and lower lows. Recent candlestick patterns exhibit selling pressure with prices consistently moving below key moving averages. The market is currently facing downward momentum, as shown by the recent bearish candles closing towards their lower ends, signaling sustained bearish sentiment.
Key Technical Indicators:
Parabolic SAR: The Parabolic SAR dots are consistently positioned above the candlesticks, clearly indicating bearish momentum. This technical indicator confirms the ongoing selling pressure in the EURUSD pair.
Moving Averages (MA): The 9-period short-term MA (blue line) has crossed below the 17-period long-term MA (orange line), further confirming the bearish crossover signal and reinforcing a bearish market trend in the EUR USD price.
Volumes: Trading volume is relatively steady with notable increases during bearish candlestick formations, suggesting stronger participation from sellers compared to buyers, reinforcing the bearish bias.
MACD (Moving Average Convergence Divergence): The MACD histogram is negative and continues to extend downward, confirming the strength of bearish momentum. The MACD line remains below the signal line, indicating the potential continuation of the bearish EURUSD trend.
Williams %R (%R): The %R indicator currently sits at -75.28, suggesting oversold conditions. While this could indicate the possibility of a short-term correction or a minor pullback, the dominant trend remains bearish.
Support and Resistance:
Support: Immediate technical support for EUR/USD is located at 1.1185, coinciding with recent lows, where buyers might enter to pause bearish momentum.
Resistance: The nearest resistance level is at 1.1320, marked by recent highs and moving average convergence, potentially limiting upside corrections.
Conclusion and Consideration:
The EUR USD H4 technical chart demonstrates significant bearish momentum, supported by indicators such as the Parabolic SAR, moving averages crossover, increased bearish volume, negative MACD histogram, and oversold %R levels. Traders should exercise caution given today’s speeches from Federal Reserve members and the Eurogroup meeting, which could introduce unexpected volatility. Vigilance around mentioned support and resistance levels is advisable, with careful management of trading positions.
Disclaimer: The analysis provided for EUR/USD is for informational purposes only and does not constitute investment advice. Traders are encouraged to perform their own analysis and research before making any trading decisions on EURUSD Market conditions can change quickly, so staying informed with the latest data is essential.