Time Zone: GMT +3
Time Frame: 4 Hours (H4)
Fundamental Analysis:
The USD-CAD currency pair today is likely to experience significant volatility due to key economic news releases from both Canada and the United States. Canadian employment data, specifically the change in employment figures and the unemployment rate, is expected to strongly influence CAD strength. Better-than-expected job creation or a decline in the unemployment rate could strengthen the CAD against the USD. Conversely, several influential members of the US Federal Reserve, including Thomas Barkin, John Williams, Austan Goolsbee, Christopher Waller, Michael Barr, and Adriana Kugler, will deliver speeches today. Their commentary on future monetary policy directions and interest rates could cause fluctuations in the USD, especially if their tones are notably hawkish.
Price Action:
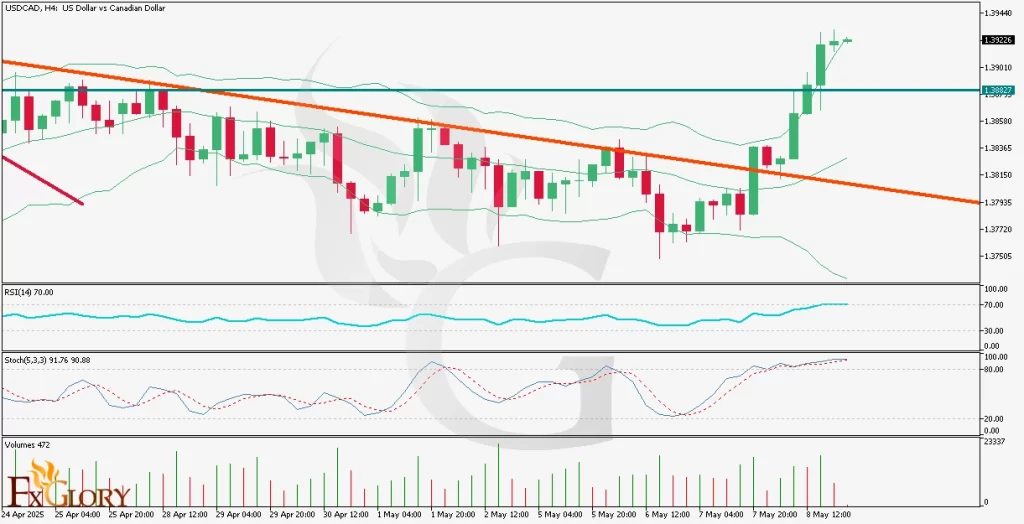
The USDCAD pair on the H4 chart has broken through the horizontal resistance at approximately 1.3882, potentially turning this level into new support upon any retest. The recent bullish candles show clear upward momentum; however, the price is currently extended significantly towards the upper Bollinger Band, suggesting a potential corrective pullback soon. Importantly, the break of the descending trend line indicates a potential shift from bearish to bullish sentiment, with recent bullish divergence observed on RSI further reinforcing this view.
Key Technical Indicators:
Bollinger Bands: The price has touched and exceeded the upper Bollinger Band, indicating it may be overextended and due for a correction or sideways consolidation to return within a normal trading range.
RSI: Currently, the RSI shows bullish momentum but is nearing the overbought territory. Recent bullish divergence at previous lows suggests the bullish trend might still have underlying strength, though traders should anticipate corrective movements.
Stochastic Oscillator: The Stochastic oscillator is deeply in overbought territory (above 90), signaling a possible short-term reversal or consolidation ahead. Caution is advised, as the price could initiate a short-term corrective phase.
Volume: Volume analysis shows relatively moderate to high trading activity during the breakout, confirming strong market participation. However, watch for volume spikes during potential corrective moves for clues about strength and continuation.
Support and Resistance:
Support: The newly established support at 1.3882 will be crucial in validating the breakout. Another significant support lies around 1.3800.
Resistance: Immediate resistance is at 1.3920 (current recent high), with the next major resistance located around the psychological level of 1.4000.
Conclusion and Consideration:
The USDCAD pair on the H4 timeframe displays bullish tendencies, strongly supported by price action and technical indicators like the Bollinger Bands, RSI, and Stochastic. However, due to the substantial bullish extension, traders should anticipate possible corrective moves toward support levels before resuming upward momentum. Today’s significant economic releases from Canada and influential speeches from US Federal Reserve members may lead to increased volatility; hence, traders should exercise caution and consider risk management strategies closely.
Disclaimer: The analysis provided for USD/CAD is for informational purposes only and does not constitute investment advice. Traders are encouraged to perform their own analysis and research before making any trading decisions on USDCAD Market conditions can change quickly, so staying informed with the latest data is essential.