Time Zone: GMT +3
Time Frame: 4 Hours (H4)
Fundamental Analysis:
Today is a pivotal day for the GBPUSD pair, as both the British Pound (GBP) and the US Dollar (USD) face key economic data releases. For the UK, inflation-related indicators including CPI y/y (2.7% vs 2.8% forecast), Core CPI y/y (3.4% vs 3.5%), RPI y/y (3.2% vs 3.4%), and HPI y/y (5.1% vs 4.9%) were released in the early hours. The slightly lower-than-expected CPI figures may reduce pressure on the Bank of England to hike rates, potentially weighing on the GBP. Later in the US session, the USD will be influenced by critical releases such as Retail Sales m/m, Core Retail Sales, and Fed Chair Powell’s speech, along with industrial production data and oil inventories. Strong US data may bolster the USD, while dovish or weaker results could sustain bullish momentum for GBPUSD.
Price Action:
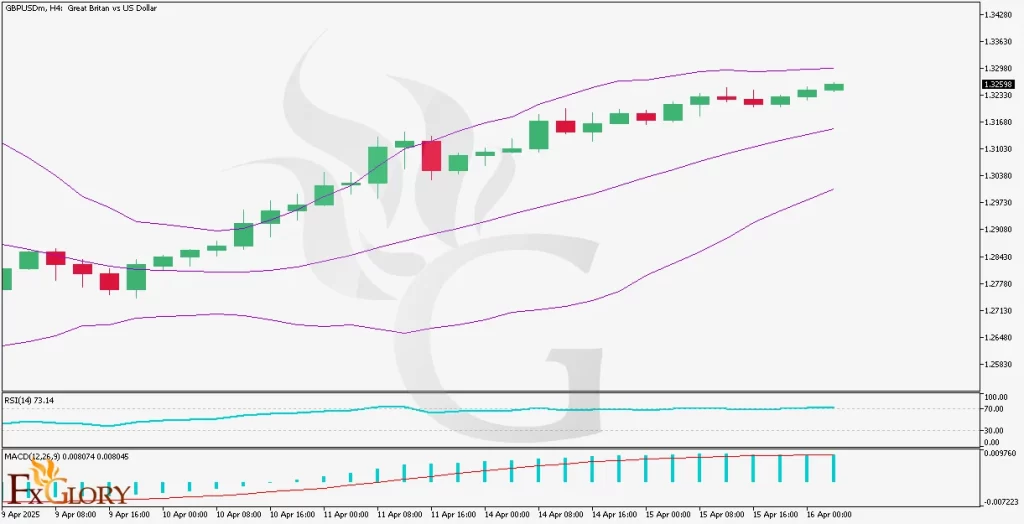
The GBPUSD H4 chart shows a strong and steady bullish trend over the past few sessions. The pair has been posting consecutive higher highs and higher lows, confirming bullish momentum. Price action is consistently hugging the upper Bollinger Band, indicating strong buying pressure. The candles have shown minimal retracements, with smaller-bodied red candles suggesting shallow corrections within the ongoing uptrend.
Key Technical Indicators:
Bollinger Bands: The GBPUSD price is trending close to the upper Bollinger Band, indicating a continuation of bullish momentum. The bands are widening, suggesting increasing volatility and the potential for further upside. The price staying above the midline signals persistent buying interest.
MACD (12,26,9): The MACD histogram bars are increasing positively, and the MACD line remains above the signal line, reinforcing the bullish bias. There is no sign of divergence, and the indicator confirms strong momentum behind the GBPUSD uptrend on the H4 chart.
RSI (14): The RSI stands at 73.14, moving into overbought territory. This suggests that while the bullish trend is strong, the pair might be susceptible to a short-term pullback or consolidation. Traders should be cautious of potential profit-taking at this level.
Support and Resistance:
Support: Immediate and next support levels are found at 1.3180, aligned with the Bollinger Bands’ midline and recent consolidation, and 1.3100, a prior structure high near the lower Bollinger Band.
Resistance: Immediate resistance: 1.39645 (50% Fibonacci retracement, EMA 21) and secondary resistance could be 1.41155 (38.2% Fibonacci retracement).
Conclusion and Consideration:
The GBPUSD H4 technical and fundamental analysis indicates that the pair is in a strong bullish phase, backed by robust price action, bullish momentum indicators, and widening Bollinger Bands. However, the RSI entering overbought territory and the high-impact news scheduled for both GBP and USD today suggest caution. Traders should monitor the upcoming US retail sales and Powell’s speech for potential volatility. A break above 1.3260 may open doors to further upside, while a rejection could initiate a pullback towards 1.3180.
Disclaimer: The analysis provided for GBP/USD is for informational purposes only and does not constitute investment advice. Traders are encouraged to perform their own analysis and research before making any trading decisions on GBPUSD. Market conditions can change quickly, so staying informed with the latest data is essential.


