Time Zone: GMT +3
Time Frame: 4 Hours (H4)
Fundamental Analysis:
GBPUSD currency pair faces notable volatility today, influenced by key events affecting the USD and GBP. The USD’s strength is closely tied to several high-impact events, including speeches by Federal Reserve Governors Adriana Kugler, Philip Jefferson, and Lisa Cook, who will discuss inflation, monetary policy, and economic outlook, respectively. Additionally, traders will closely watch the press conference by US President Donald Trump on trade and tariff policies. For GBP, today’s primary catalyst is the Services PMI, a vital indicator for assessing the UK’s economic health. Positive data would strengthen the GBP, whereas any negative surprises may weaken the currency significantly.
Price Action:
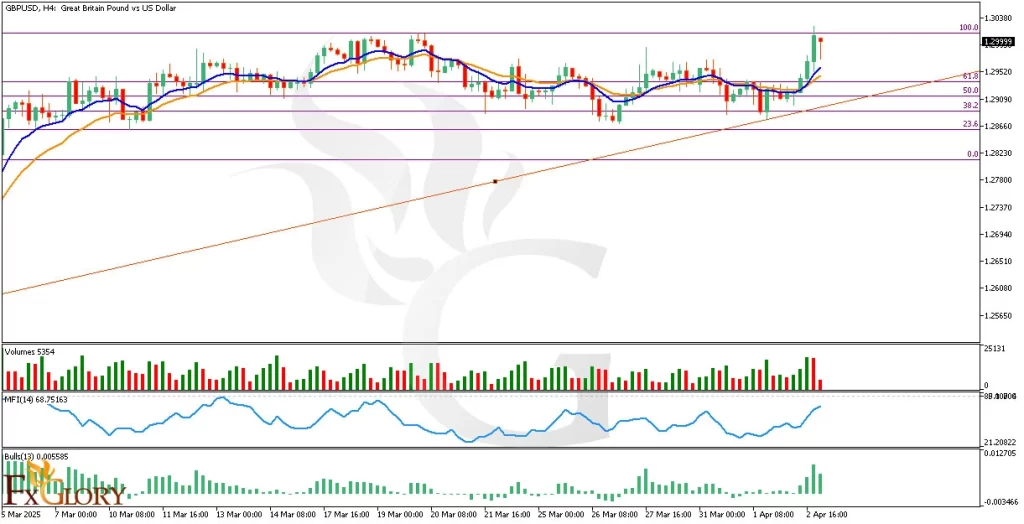
Analyzing GBP/USD price action on the H4 timeframe, the recent candles have indicated upward momentum. However, the latest candle formation is bearish and red, suggesting potential short-term resistance. The pair recently broke above significant Fibonacci retracement levels, signaling bullish sentiment, but the bearish candle indicates caution as price may retest nearby support levels.
Key Technical Indicators:
Moving Averages (MA): The short-term MA (9-period, blue) recently crossed above the long-term MA (17-period, orange), suggesting a bullish crossover. Although both lines remain close, this crossover typically indicates positive momentum; traders should observe the MA spacing carefully, as tighter convergence could signal weakening bullish sentiment.
Volumes: Trading volumes have shown some increases with bullish movements, but the latest bearish candle accompanies declining volume, hinting that sellers’ strength might be limited and temporary, thus keeping the underlying bullish outlook intact.
Money Flow Index (MFI): The MFI stands at approximately 68.75, close to the overbought territory. It has been rising, indicating strong buying pressure. However, traders should remain cautious as nearing overbought conditions could signal possible retracement or consolidation in the short term.
Bulls Power: The Bulls Power indicator has displayed positive momentum recently, aligning with the upward movement. However, the latest reading shows a slight decrease, suggesting weakening bullish momentum, confirming the cautious stance noted by the recent bearish candle.
Support and Resistance Levels:
Support: Immediate support is at approximately 1.2952, coinciding with the Fibonacci 61.8% retracement level and the recent breakout area.
Resistance: Current resistance is at around 1.3038, matching recent highs and Fibonacci extension levels.
Conclusion and Consideration:
The GBP USD H4 chart shows an ongoing bullish trend, confirmed by positive moving average crossover and strong Money Flow Index readings. However, the latest bearish candle and declining Bulls Power highlight the need for caution, as traders anticipate upcoming key economic announcements from both the US and UK. Maintaining vigilance around support at 1.2952 and resistance at 1.3038 is recommended, especially in response to the anticipated volatility from today’s fundamental news.
Disclaimer: The analysis provided for GBP/USD is for informational purposes only and does not constitute investment advice. Traders are encouraged to perform their own analysis and research before making any trading decisions on GBPUSD. Market conditions can change quickly, so staying informed with the latest data is essential.


