Time Zone: GMT +2
Time Frame: 4 Hours (H4)
Fundamental Analysis
Gold (XAU/USD) is currently experiencing a period of volatility as global markets react to key economic data releases and geopolitical developments. Today, the USD is expected to be influenced by several economic indicators, including the JOLTS job openings report, which provides insight into labor market strength, and the NFIB Small Business Index, a gauge of economic confidence among small businesses. Additionally, US President Donald Trump’s press conference may introduce further uncertainty, potentially impacting the USD and safe-haven assets like gold. Investors are closely monitoring these developments to assess the future direction of the US Dollar, which plays a crucial role in gold’s price movement.
Price Action
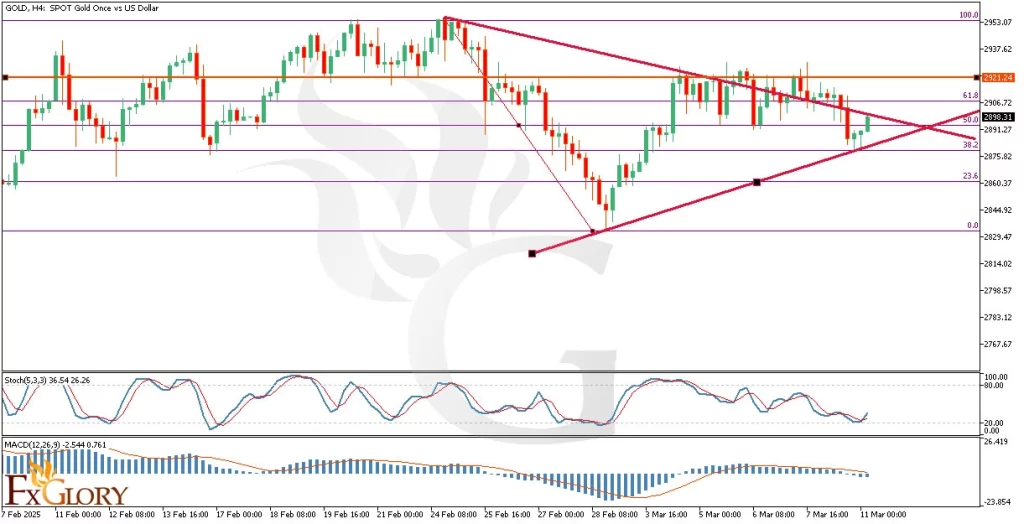
Gold (XAU/USD) on the H4 timeframe shows a corrective movement after a recent bearish phase. The price is currently testing the 50% Fibonacci retracement level, which acts as a critical decision point. The last three candles indicate a slight bullish reversal attempt, suggesting that buyers are regaining some control. However, the price remains within a symmetrical triangle formation, signaling potential breakout opportunities in either direction. If gold breaks above key resistance levels, we may see further bullish momentum, whereas a failure could push the price lower.
Key Technical Indicators
Stochastic Oscillator: The Stochastic (5,3,3) indicator is around 36.54, indicating that the price is not yet in overbought conditions but has room to move upward. If it crosses above 50, it could signal further bullish momentum.
MACD (Moving Average Convergence Divergence): The MACD histogram shows weak momentum, with the MACD line slightly below the signal line, suggesting a consolidation phase. A bullish crossover could confirm a trend reversal, while a continued bearish divergence may signal further downside.
Support and Resistance:
Support: The nearest support is at 2860, which aligns with the 23.6% Fibonacci retracement level and acts as a strong price floor. Below this, 2829 serves as a key psychological and structural support from previous consolidation.
Resistance: The immediate resistance is at 2906, corresponding to the 61.8% Fibonacci retracement level, which could act as a strong barrier. A break above this level could push prices towards 2921, a key horizontal resistance and potential breakout zone from the symmetrical triangle.
Conclusion and Consideration
The Gold (XAU/USD) H4 outlook suggests that the price is at a critical decision zone around the 50% Fibonacci level. The next move depends on whether buyers can sustain momentum above this level. The symmetrical triangle pattern signals an upcoming breakout, with 2906 as the key resistance to watch for a bullish continuation. On the downside, failure to hold 2891 could lead to a retest of lower support levels near 2860 and 2829.
Traders should keep an eye on USD news today, especially the JOLTS job openings report, NFIB small business sentiment index, and Trump’s press conference, as these events could trigger volatility in gold prices.
Disclaimer: The analysis provided for XAU/USD is for informational purposes only and does not constitute investment advice. Traders are encouraged to perform their own analysis and research before making any trading decisions on XAUUSD. Market conditions can change quickly, so staying informed with the latest data is essential.