Time Zone: GMT +2
Time Frame: 4 Hours (H4)
Fundamental Analysis
The EURCHF currency pair will be influenced by multiple forthcoming economic reports and events. On the Euro (EUR) side, market participants await the Destatis data releases on industrial production and trade balance (slated for April 7, 2025), as well as the Eurogroup meeting on April 11, 2025. Stronger-than-forecast figures could boost the EUR, while cautious commentary from Eurozone officials could dampen sentiment. Meanwhile, the Swiss Franc (CHF) reacts to SECO’s consumer climate data (due April 10, 2025); a better-than-expected reading may fortify the CHF, potentially adding downside pressure on EURCHF.
Price Action
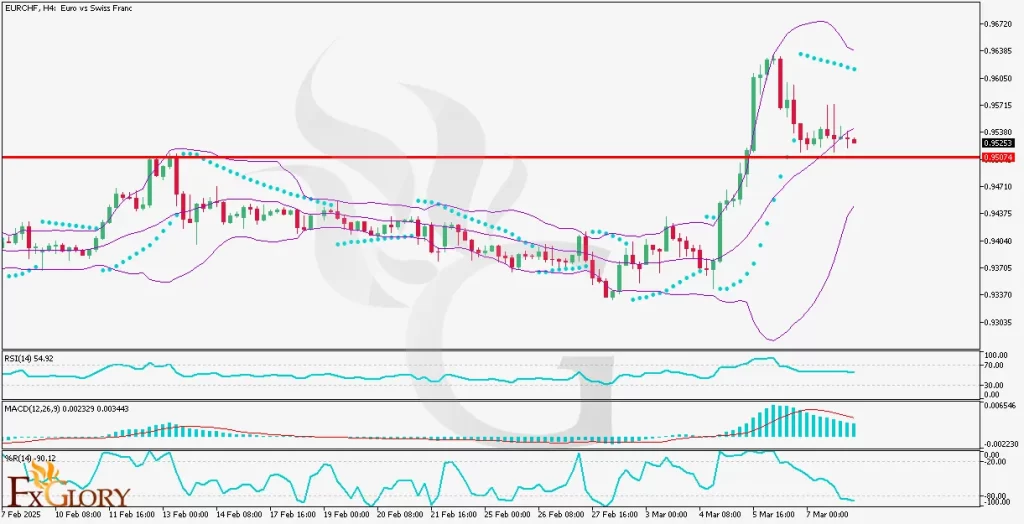
On the H4 chart, EURCHF broke above a key resistance near 0.9523 and is now retesting this region as potential support. The pair is hovering around the middle Bollinger Band, which can act as a dynamic support. Bollinger Bands are narrowing, implying lower volatility prior to a probable expansion. If price action respects the 0.9523 level, the uptrend may continue, whereas a clear break below it could signal a deeper pullback.
Key Technical Indicators
Bollinger Bands: The Bollinger Bands on EURCHFH4 have been tightening, typically a precursor to a volatility surge. Price is testing the middle band, indicating a support zone that may help sustain the recent breakout. A move above the upper band could confirm bullish momentum continuation.
RSI (Relative Strength Index): Currently around 54, the RSI signals moderate bullish momentum without entering overbought territory. This leaves room for additional upside, though a drop below the 50 mark would hint at weakening bullish interest and an increased chance of further correction.
MACD (Moving Average Convergence Divergence): The MACD line remains above the signal line, albeit with a contracting histogram. While this setup still leans bullish, diminishing momentum points to a possibility of a short-term retracement. Traders should watch for a bearish crossover to confirm any deeper pullback.
Williams %R (Williams Percent Range) Hovering near oversold conditions (around -90), Williams %R suggests that selling pressure could be losing steam. A climb above -80 would indicate a shift back into bullish territory, aligning with a potential resumption of the uptrend.
Support and Resistance
Support: Immediate support is located at 0.9523, which aligns with a recently broken resistance level and the middle Bollinger Band.
Resistance: The nearest resistance level is at 0.9600, which corresponds to a minor psychological barrier and recent swing high.
Conclusion and Consideration
The EURCHFH4 technical and fundamental chart daily analysis points to a cautiously bullish outlook, contingent on the 0.9523 support zone holding firm. Key technical indicators, including Bollinger Bands, RSI, MACD, and Williams %R, suggest that the uptrend could continue if buyers defend this level. However, traders should closely monitor upcoming Eurozone (Destatis, Eurogroup) and Swiss (SECO) data releases, as unexpected readings may trigger volatility and alter EURCHF’s price action.
Disclaimer: The analysis provided for EUR/CHF is for informational purposes only and does not constitute investment advice. Traders are encouraged to perform their own analysis and research before making any trading decisions on EURCHF. Market conditions can change quickly, so staying informed with the latest data is essential.