Time Zone: GMT +2
Time Frame: 4 Hours (H4)
Fundamental Analysis:
The AUDUSD pair remains under pressure as the US Dollar (USD) strengthens ahead of key events today. The Federal Reserve’s (FOMC) Williams is scheduled to speak, which could provide insights into future monetary policy directions, potentially impacting USD volatility. Additionally, the RCM/TIPP Economic Optimism Index is expected to show improvement, reinforcing USD strength.
On the Australian Dollar (AUD) side, the market will closely monitor the RBA Deputy Governor Hauser’s speech, as any hawkish remarks could support AUD. Furthermore, key data releases such as the Monetary Policy Meeting Minutes, Retail Sales (forecast 0.3% vs. previous -0.1%), and Current Account (-11.8B vs. -14.1B) could impact AUD’s short-term trajectory. Should retail sales exceed expectations, we may see a temporary boost in AUD, but bearish sentiment prevails given current technical conditions.
Price Action:
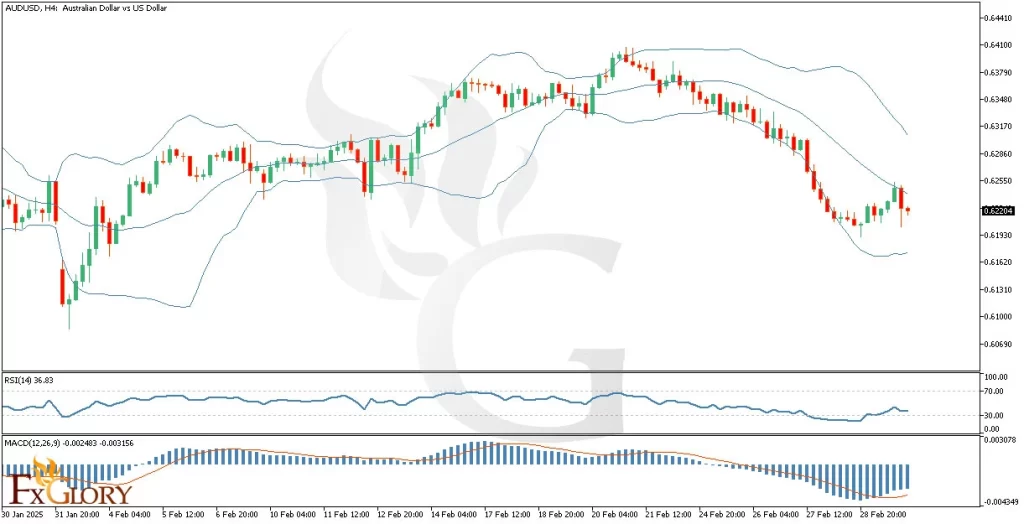
The AUDUSD pair has been in a sharp bearish phase, trading within the lower Bollinger Band before entering a correction phase. This corrective movement led the price back toward the midline of the Bollinger Bands, assisting the RSI in recovering from oversold conditions. However, after testing the midline resistance, the pair has resumed its bearish wave, reflecting persistent downward momentum. The MACD indicator also suggests a continuation of the downtrend, as the histogram remains in negative territory with bearish divergence strengthening.
Key Technical Indicators:
Bollinger Bands: The price initially declined sharply, remaining near the lower band before attempting a recovery. The midline acted as resistance, rejecting further upside and resuming the bearish wave. The continued expansion of the bands indicates high volatility, favoring further downside movement.
MACD (Moving Average Convergence Divergence): The MACD line remains below the signal line, with a bearish histogram indicating ongoing selling pressure. This setup suggests that the bearish trend could persist unless a bullish crossover occurs.
RSI (Relative Strength Index): The RSI rebounded from oversold territory but is now struggling near 36.83, still indicating weak momentum. If the RSI moves below 30, it could signal further selling pressure and potential downside continuation.
Support and Resistance:
Support: The AUDUSD pair faces key resistance levels at 0.62530, aligning with the midline of the Bollinger Bands, followed by 0.62350, marking a recent swing high, and 0.62300, a psychological level that previously acted as support but has now turned into resistance.
Resistance: On the downside, immediate support is seen at 0.61700, reflecting recent lows, followed by 0.61400, a stronger historical level, and 0.61150, which serves as a major support zone; a break below this level could trigger further downside momentum.
Conclusion and Consideration:
The AUDUSD H4 analysis indicates that the pair remains in a strong bearish trend, with technical indicators such as the MACD, RSI, and Bollinger Bands aligning for further downside movement. The rejection from the Bollinger Band’s midline confirms ongoing selling pressure, while the MACD histogram remains negative, reinforcing bearish momentum. Traders should watch for potential volatility due to upcoming USD and AUD economic releases, especially the FOMC speech and Australian Retail Sales data. If AUD fundamentals disappoint, the pair could retest 0.61700 and potentially lower support levels.
Disclaimer: The analysis provided for AUD/USD is for informational purposes only and does not constitute investment advice. Traders are encouraged to perform their own analysis and research before making any trading decisions on AUDUSD. Market conditions can change quickly, so staying informed with the latest data is essential.