
EURNZD Forecast

EUR iconNZD icon
EUR/NZD

Euro vs New Zealand Dollar

EUR/NZD Live Price

2.00440
+0.15%

EUR/NZD Forecast — 14 September 2026

Time Zone: GMT +3

Time Frame: Daily (D1) / Weekly Outlook

Weekly Fundamental Overview:

The EUR/NZD pair reflects the relative balance between Eurozone economic performance and New Zealand’s broader risk sentiment. Market participants remain focused on upcoming economic surveys across key European economies to gauge the strength of business activity and monetary policy trends. Meanwhile, the New Zealand Dollar remains sensitive to global risk appetite and commodity flows, making the pair responsive to macroeconomic developments.

Price Action:

On the Daily (D1) chart, EUR/NZD recently pulled back slightly to close at 1.99483 after climbing toward the 2.00250 mark. The overall structure demonstrates a strong upward push from previous consolidation levels near 1.95328 and 1.95835, though recent candle dynamics suggest some resistance near current highs.

Key Technical Indicators:

Bollinger Bands: The D1 Bollinger Bands display a middle band at 1.97085, an upper band at 1.99882, and a lower band at 1.94287. With the last close at 1.99483, price action is hovering near the upper boundary, indicating elevated upside volatility and potential sensitivity to overextended momentum.

RSI: The 14-day Relative Strength Index (RSI) stands at 64.42, signaling firm buying pressure while remaining below the overbought threshold of 70.

MACD: The D1 MACD indicator records a reading of 0.00695, remaining above the zero threshold and reflecting ongoing positive momentum for EUR/NZD.

Support and Resistance:

Key technical levels on the daily time frame highlight primary support at 1.94349 and main resistance at 2.02330. The middle Bollinger Band at 1.97085 acts as an intermediate dynamic support zone.

News to Watch for EURNZD This Week:

  • French Flash Services PMI: This release measures activity in France's service sector and can impact expectations for broader Eurozone economic health.
  • French Flash Manufacturing PMI: This survey reflects operational conditions in French manufacturing and offers insight into industrial demand across the region.
  • German Flash Services PMI: Tracking performance in Germany's key service industry, this report provides crucial signals regarding overall economic momentum in the Eurozone.

Weekly Outlook and Consideration:

The weekly outlook for EUR/NZD remains constructively positioned following its surge toward 2.00250 and last close at 1.99483. Technical indicators on the D1 chart, including an RSI of 64.42 and positive MACD at 0.00695, point to firm underlying momentum. A sustained push could see price test major resistance at 2.02330, whereas a pullback below the upper Bollinger Band could lead to a retest of intermediate support near the 1.97085 middle band. Macroeconomic releases from Europe, particularly Flash PMI surveys, will likely influence sentiment and determine whether the pair can extend its upward trajectory.

Disclaimer: The analysis provided for EUR/NZD is for informational purposes only and does not constitute investment advice. Traders are encouraged to perform their own analysis and research before making any trading decisions. Market conditions can change quickly, so staying informed with the latest data is essential.
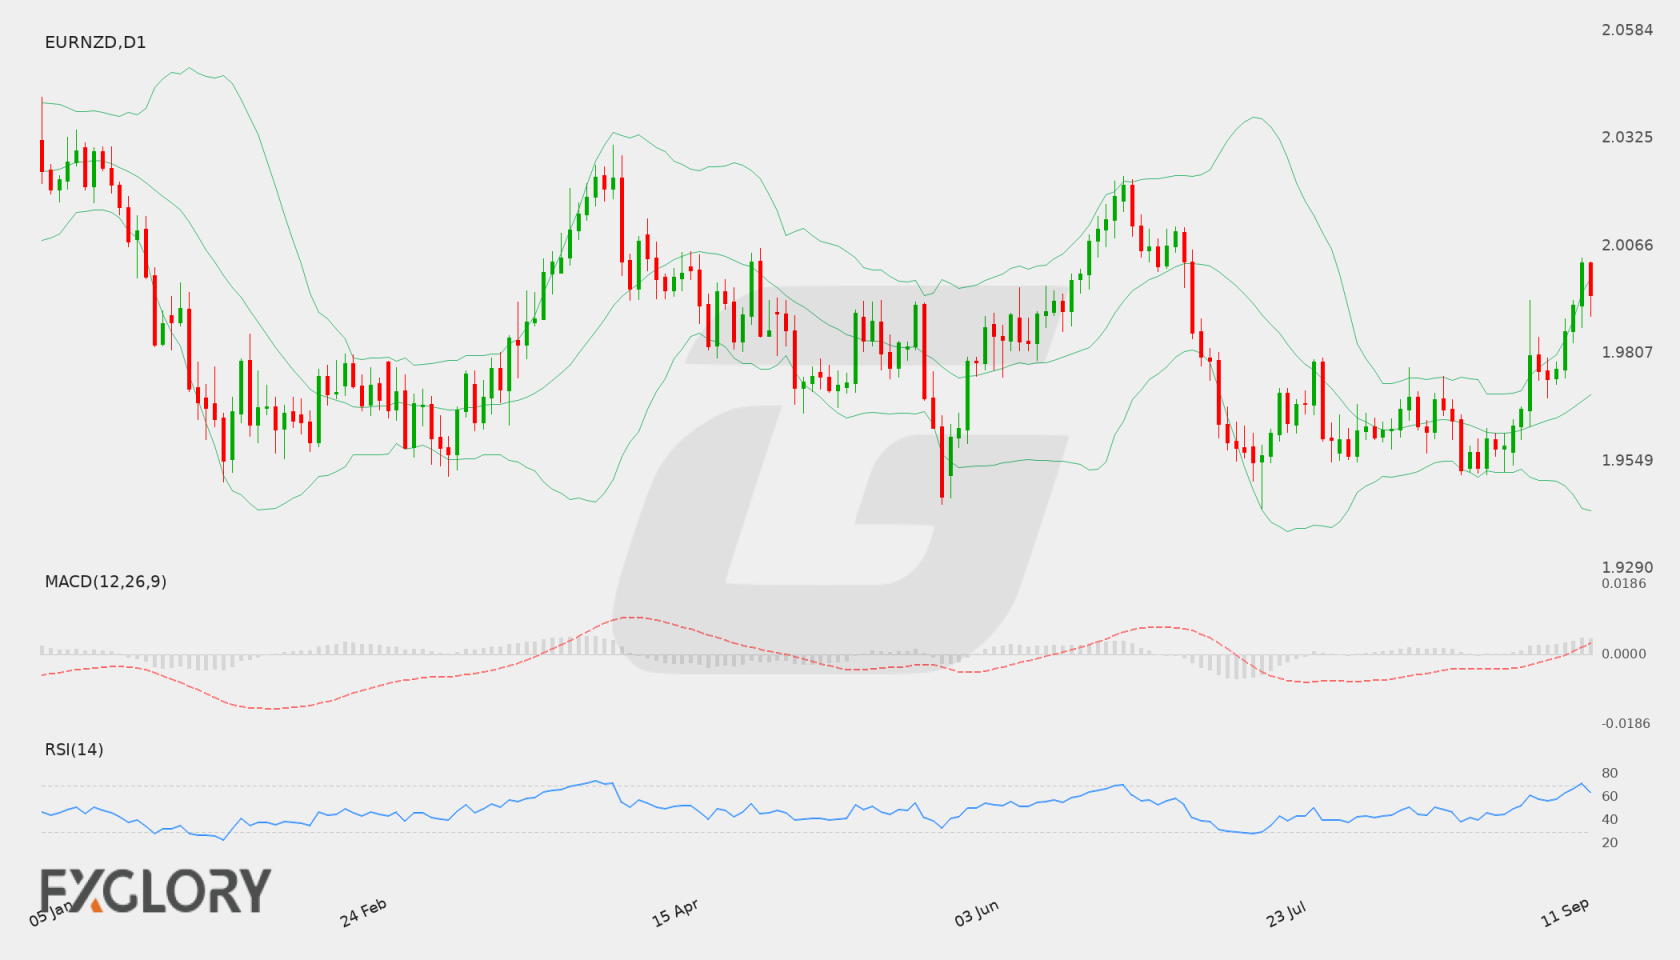
EUR/NZD D1 technical analysis chart
EUR/NZD D1 Technical Analysis for 09.14.2026

EUR/NZD Forecast — 22 August 2026

Time Zone: GMT +3

Time Frame: Daily (D1) / Weekly Outlook

Weekly Fundamental Overview:

The fundamental context for EUR/NZD this week is driven by key inflation metrics out of the Eurozone and monetary policy announcements from New Zealand. Eurozone inflation data, including the German Prelim CPI m/m alongside headline and Core CPI Flash Estimates, will offer insights into European price pressures. Meanwhile, the Reserve Bank of New Zealand’s interest rate decision, Official Cash Rate announcement, and Monetary Policy Statement will significantly sway sentiment around the kiwi dollar.

Price Action:

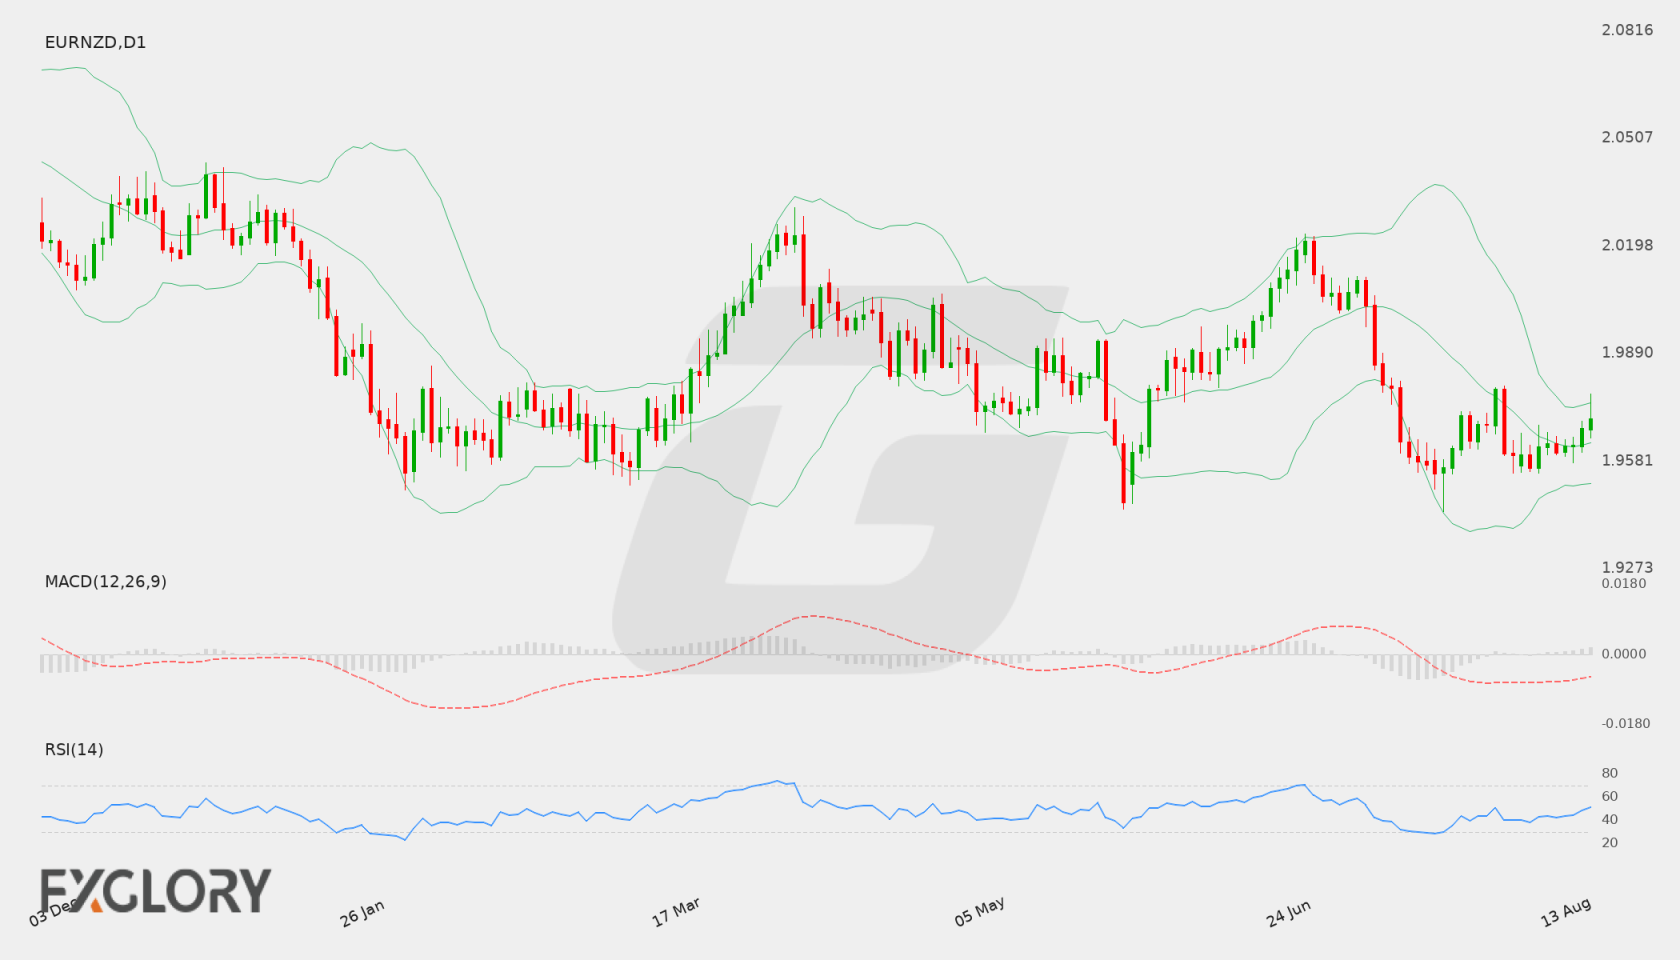
EUR/NZD closed the latest daily session at 1.96461. The pair has experienced moderate consolidation in recent trading days, fluctuating within a relatively tight range between 1.9600 and 1.9700. The broader structure shows a pullback from recent highs, settling into a near-term neutral stance.

Key Technical Indicators:

Bollinger Bands: On the daily D1 chart, the middle Bollinger band is positioned at 1.96455, with the upper band at 1.97430 and the lower band at 1.95480. With the close at 1.96461 sitting directly at the middle band, price action indicates a balanced market awaiting volatility expansion.

RSI: The 14-day Relative Strength Index (RSI) is at 46.77. Being positioned just below the 50 level, it signals a neutral market sentiment with no current overbought or oversold extremes.

MACD: The daily MACD indicator stands at -0.00262, residing slightly below the zero signal line. This reflects a mild underlying bearish tone, though the indicator's slope remains relatively flat in the near term.

Support and Resistance:

Key technical levels for the EUR/NZD pair include primary support at 1.94349 and major technical resistance at 2.02330.

News to Watch for EURNZD This Week:

  • German Prelim CPI m/m: This release offers an early look at German inflation trends that could influence European policy expectations.
  • CPI Flash Estimate y/y: Tracks headline consumer price growth across the Eurozone to gauge broader inflationary pressures.
  • Core CPI Flash Estimate y/y: Measures underlying Eurozone inflation by excluding volatile items to provide key insight on price stability.
  • RBNZ Monetary Policy Statement: Outlines the Reserve Bank of New Zealand's economic projections and policy strategy.
  • Official Cash Rate: Sets the benchmark interest rate for New Zealand, directly impacting the valuation of the kiwi dollar.
  • RBNZ Rate Statement: Provides official reasoning behind the central bank's latest benchmark interest rate decision.
  • RBNZ Press Conference: Gives central bank leadership an opportunity to elaborate on policy decisions and answer questions regarding the economic outlook.

Weekly Outlook and Consideration:

EUR/NZD enters the week in a consolidated state around 1.96461, trading right on its daily middle Bollinger band of 1.96455. Technical momentum indicators, including an RSI of 46.77 and a MACD of -0.00262, suggest a neutral-to-soft tone. Should selling pressure resume, key support at 1.94349 remains the downside level to watch, whereas a move higher would target resistance near 2.02330. Imminent Eurozone CPI figures and RBNZ central bank announcements are expected to serve as potential catalysts for directional breakout moves.

Disclaimer: The analysis provided for EUR/NZD is for informational purposes only and does not constitute investment advice. Traders are encouraged to perform their own analysis and research before making any trading decisions. Market conditions can change quickly, so staying informed with the latest data is essential.
EUR/NZD Forecast — 15 August 2026

Time Zone: GMT +3

Time Frame: Daily (D1) / Weekly Outlook

Weekly Fundamental Overview:

The EUR/NZD pair reflects a balance between Eurozone macroeconomic conditions and broader risk sentiment. Fundamental direction for EUR/NZD will largely depend on incoming European economic health indicators, particularly Flash PMI surveys, alongside overall global risk appetite which typically impacts the commodity-linked New Zealand Dollar.

Price Action:

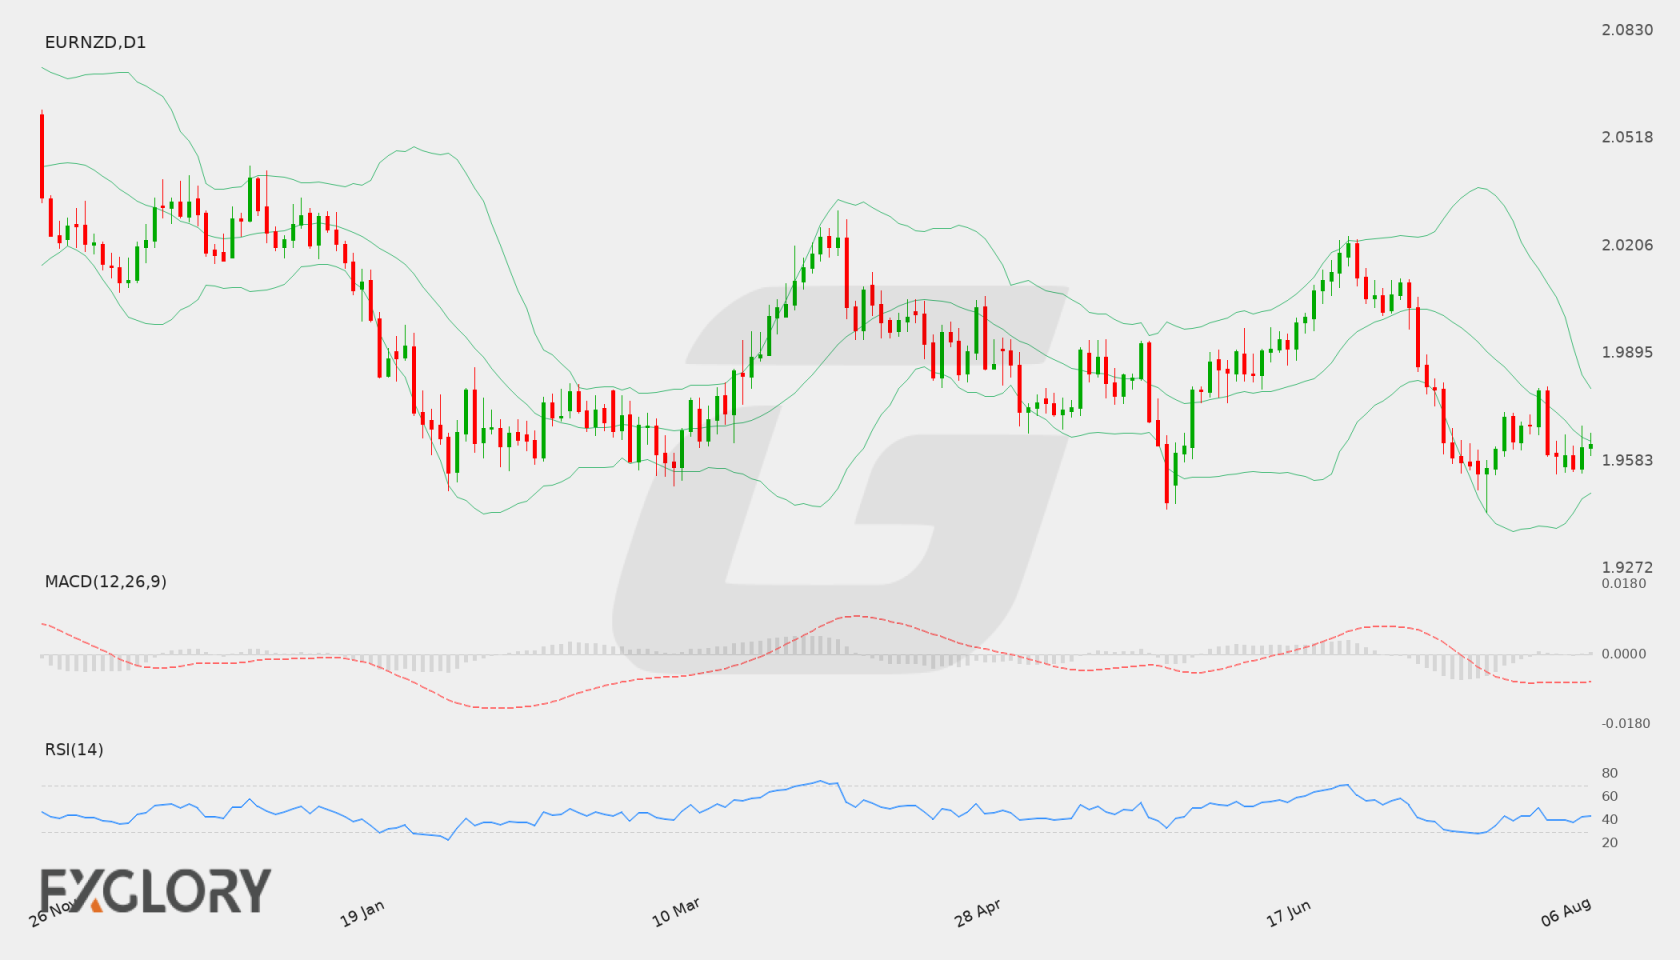
On the Daily (D1) chart, EUR/NZD recently closed at 1.97023 after advancing from recent lows near 1.95613. The pair has experienced a steady upward push over the last few trading sessions, reflecting short-term bullish momentum within its broader daily range.

Key Technical Indicators:

Bollinger Bands: The D1 Bollinger Bands show a middle band at 1.96324, an upper band at 1.97485, and a lower band at 1.95164. Price action is trading above the middle line and approaching the upper band, indicating elevated short-term bullish pressure.

RSI: The 14-period Relative Strength Index (RSI) stands at 50.78, indicating a neutral bias without immediate overbought or oversold conditions.

MACD: The MACD line sits at -0.00415, remaining slightly below zero. While still in negative territory, the recent upward price movement reflects a gradual loss of bearish momentum on the daily scale.

Support and Resistance:

Key technical levels for EURNZD include primary support at 1.94349 and key upper resistance at 2.02330.

News to Watch for EURNZD This Week:

  • French Flash Services PMI: Assesses economic health within the French service sector, influencing overall sentiment for the Euro.
  • French Flash Manufacturing PMI: Measures manufacturing activity in France, offering insight into regional industrial trends.
  • German Flash Manufacturing PMI: Reflects operational conditions in Germany's manufacturing sector, serving as a key driver for Euro price action.

Weekly Outlook and Consideration:

EUR/NZD enters the week with a neutral-to-bullish short-term stance on the D1 chart, having moved above its middle Bollinger Band level of 1.96324 to close near 1.97023. An RSI reading near 50.78 reflects balanced market conditions, while a negative MACD of -0.00415 points to underlying medium-term consolidation. Traders will be monitoring support at 1.94349 and resistance at 2.02330, with Eurozone Flash PMI releases potentially acting as catalysts for directional momentum.

Disclaimer: The analysis provided for EUR/NZD is for informational purposes only and does not constitute investment advice. Traders are encouraged to perform their own analysis and research before making any trading decisions. Market conditions can change quickly, so staying informed with the latest data is essential.
EUR/NZD D1 technical analysis chart
EUR/NZD D1 Technical Analysis for 08.15.2026

EUR/NZD Forecast — 9 August 2026

Time Zone: GMT +3

Time Frame: Daily (D1) / Weekly Outlook

Weekly Fundamental Overview:

The EUR/NZD pair continues to evaluate economic conditions across the Eurozone against New Zealand dollar dynamics. Trading near the 1.96311 region, market participants remain focused on upcoming European economic performance data to determine the euro’s directional strength relative to commodity-linked risk currencies.

Price Action:

On the daily (D1) timeframe, EUR/NZD recently closed at 1.96311 after stabilizing above recent lows near 1.9546. Recent candle formations reflect a period of consolidation as price action stays bounded between recent swings.

Key Technical Indicators:

Bollinger Bands: The Bollinger Bands reveal a middle line at 1.96411, an upper band at 1.97934, and a lower band at 1.94889. With the current price of 1.96311 sitting near the middle band, volatility remains relatively stable with price positioned near the center of its recent trading range.

RSI: The 14-day Relative Strength Index (RSI) stands at 43.72. Resting below the 50 mark, it signals moderate downside sentiment while staying well clear of oversold conditions.

MACD: The MACD indicator records a reading of -0.00674. Remaining below the zero mark, it points to ongoing underlying bearish momentum, though the histogram reflects limited expansion.

Support and Resistance:

Key technical resistance is defined at 2.02330, marking the primary upside ceiling. On the downside, critical technical support is located at 1.94349, serving as a key floor for price action.

News to Watch for EURNZD This Week:

  • French Flash Services PMI: Measures economic activity in the French services sector and offers direction for Eurozone growth expectations.
  • French Flash Manufacturing PMI: Assesses business conditions in France's manufacturing industry, impacting euro sentiment.
  • German Flash Manufacturing PMI: Tracks manufacturing health in Europe's largest economy, serving as a primary driver for the euro.

Weekly Outlook and Consideration:

The EUR/NZD weekly outlook indicates potential range-bound movement around current levels. Holding near 1.96311 close to the middle Bollinger Band of 1.96411, the pair displays mild downside bias reflected by an RSI of 43.72 and MACD of -0.00674. A move higher would face resistance toward 2.02330, while renewed selling pressure could retest major support near 1.94349. Upcoming French and German Flash PMI releases will likely influence short-term euro direction.

Disclaimer: The analysis provided for EUR/NZD is for informational purposes only and does not constitute investment advice. Traders are encouraged to perform their own analysis and research before making any trading decisions. Market conditions can change quickly, so staying informed with the latest data is essential.

EUR/NZD D1 technical analysis chart
EUR/NZD D1 Technical Analysis for 08.09.2026

EUR/NZD Forecast — 2 August 2026

Time Zone: GMT +4

Time Frame: 4 Hours (H4)

Fundamental Analysis:

With no economic calendar events supplied for the current tracking session, fundamental drivers for EUR/NZD (EURNZD) remain quiet. Traders are focusing on technical momentum and prevailing market sentiment across the H4 timeframe.

Price Action:

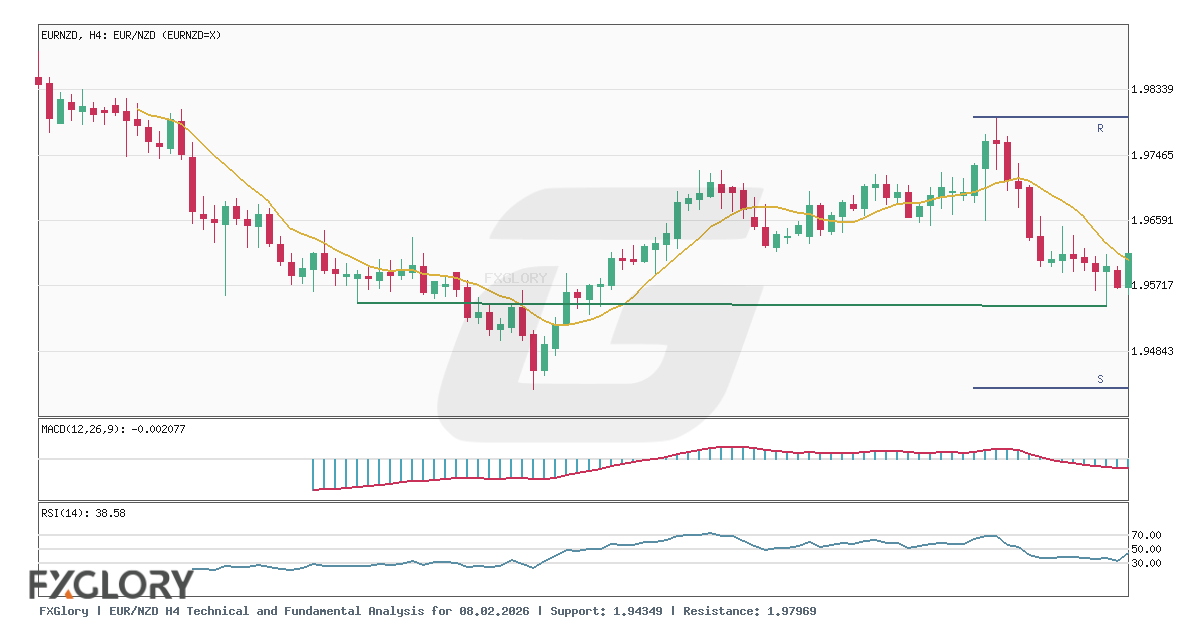
Recent price action on the H4 chart shows EUR/NZD retreating from recent highs near 1.97860 down toward the latest close at 1.95879. The pair has demonstrated consistent selling pressure, sliding past 1.96500 and trading near the lower boundary of its recent range.

Key Technical Indicators:

Bollinger Bands(20,2.000): The Bollinger Bands indicator highlights a middle SMA line at 1.96680, with an upper band situated at 1.97831 and a lower band at 1.95528. Trading at 1.95879, EUR/NZD remains positioned in the lower half of the band range, pointing to dominant short-term selling force toward lower band support.

MACD(12,26,9): The MACD indicator records a reading of -0.00208, holding below the zero mark. This sub-zero value signals that bearish momentum continues to prevail on the H4 chart for EURNZD.

RSI(14): The 14-period Relative Strength Index (RSI) is currently reading 38.58. Operating beneath the neutral 50 level, the RSI reflects underlying bearish strength while holding above the oversold boundary of 30.

Support and Resistance:

Key dynamic and horizontal technical levels feature key support at 1.94349 and key resistance at 1.97969. Dynamic resistance sits near the upper Bollinger Band at 1.97831, while lower band support lies around 1.95528.

Conclusion and Consideration:

EUR/NZD (EURNZD) maintains a short-term bearish outlook on the H4 chart, remaining below the middle Bollinger Band of 1.96680 with an RSI of 38.58 and a negative MACD of -0.00208. Market participants are monitoring if price will test lower support near 1.95528 and 1.94349 or mount a retracement back toward resistance at 1.97969.

Disclaimer: The analysis provided for EUR/NZD is for informational purposes only and does not constitute investment advice. Traders are encouraged to perform their own analysis and research before making any trading decisions. Market conditions can change quickly, so staying informed with the latest data is essential.

EUR/NZD H4 technical and fundamental analysis
EUR/NZD H4 Technical and Fundamental Analysis for 08.02.2026
1EUR = –––NZD –––%
EURNZD
Loading chart...