Time Zone: GMT +2
Time Frame: 4 Hours (H4)
Fundamental Analysis:
Gold (XAU/USD) is trading near all-time highs as global market sentiment remains cautious. Today, several high-impact USD news events could influence gold prices. US President Donald Trump’s speech at the FII Priority Summit in Miami may provide insights into economic policies that could impact the dollar’s strength. Additionally, Federal Reserve Governor Philip Jefferson’s speech on household balance sheets and initial jobless claims data will shape expectations for future interest rate decisions. If the Federal Reserve adopts a hawkish tone, gold could face downward pressure due to a stronger USD. Conversely, weaker jobless claims or a dovish Fed stance could support gold prices as investors seek safe-haven assets. Traders should also monitor the Philadelphia Fed Business Outlook Survey, which may offer clues about US economic conditions, further impacting gold’s direction.
Price Action:
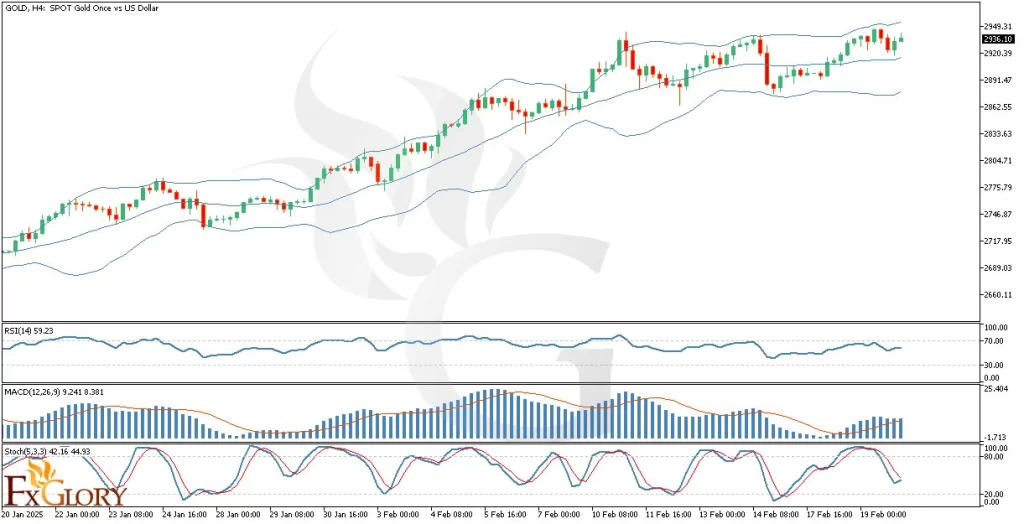
The GOLDUSD H4 chart exhibits a strong bullish trend, with prices moving within the upper half of the Bollinger Bands. Despite minor retracements, the price remains within an upward structure, suggesting ongoing buyer dominance. A key observation is that the recent pullback has been shallow, indicating that bulls still control the market. If the price sustains above the middle Bollinger Band, further upside movement is likely. However, a breakdown below this level may trigger a deeper correction.
Key Technical Indicators:
Bollinger Bands: The price is currently moving between the middle and upper bands, attempting to reach the upper band again. The overall trend remains bullish, with gold maintaining its strength after breaking multiple all-time highs (ATHs) in recent months.
RSI (Relative Strength Index): The RSI is hovering near 59, suggesting that the market remains in bullish territory but is not yet overbought. This indicates that there is still room for further price appreciation before reaching extreme levels.
MACD (Moving Average Convergence Divergence): The MACD histogram is expanding, with the MACD line positioned above the signal line. This suggests increasing bullish momentum, reinforcing the strength of the uptrend. However, traders should watch for potential divergence, which could indicate a slowdown in momentum.
Stochastic Oscillator: The Stochastic indicator is currently around 42-44, moving out of the oversold region. If the %K line crosses above the %D line, it could confirm a bullish continuation, supporting a move toward higher resistance levels.
Support and Resistance Levels:
Support: The first key support level is at $2,920, aligning with the middle Bollinger Band and a recent price consolidation area. A break below this level could see further downside toward $2,880.
Resistance: The immediate resistance is at $2,950, which represents the recent high and upper Bollinger Band. A breakout above this level could lead to further gains toward $2,970 and beyond.
Conclusion and Consideration:
Gold remains in a strong uptrend, supported by bullish technical indicators and fundamental factors. With key USD news events today, traders should expect high volatility in the gold market. If the Federal Reserve signals a hawkish stance, gold could face some selling pressure due to a stronger USD. However, if economic concerns arise or jobless claims come in weaker than expected, gold may continue its bullish rally. Traders should closely monitor XAUUSD’s price action around the $2,920 support and $2,950 resistance levels for potential breakouts or pullbacks.
Disclaimer: The analysis provided for XAU/USD is for informational purposes only and does not constitute investment advice. Traders are encouraged to perform their own analysis and research before making any trading decisions on XAUUSD. Market conditions can change quickly, so staying informed with the latest data is essential.