Time Zone: GMT +2
Time Frame: 4 Hours (H4)
Fundamental Analysis:
The AUD/USD currency pair is currently influenced by several key fundamental factors. The US Dollar’s strength remains in focus as traders await the latest Building Permits and Housing Starts data from the US Census Bureau, which serve as leading indicators for economic activity and construction demand. A stronger-than-expected release could support the USD and apply downward pressure on AUD/USD. Meanwhile, Australia’s economic outlook is shaped by the Melbourne Institute Leading Index and the Wage Price Index, which provide insight into economic growth and inflation trends. If these indicators reflect economic resilience, the AUD could find support. Additionally, market participants will be closely monitoring RBNZ Governor Adrian Orr’s testimony, as any hawkish tone on interest rates could impact risk sentiment and commodity-linked currencies like the AUD.
Price Action:
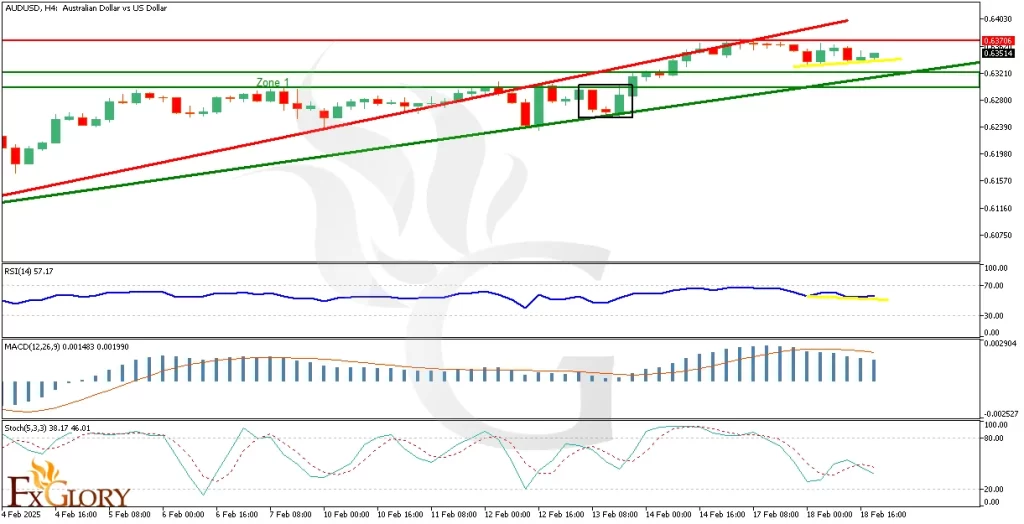
On the H4 chart, AUD-USD has been in an uptrend following a Morning Star candlestick pattern at the ascending trendline support. The price has reached a key resistance level and is now undergoing a correction. This pullback could extend to Zone 1, where buyers may re-enter the market before the next upward move. The presence of higher highs and higher lows suggests that the overall trend remains bullish unless there is a confirmed break below key support.
Key Technical Indicators:
RSI (Relative Strength Index): The RSI is currently around 57.17, showing a possible divergence. This suggests a weakening bullish momentum, although it has not yet entered overbought conditions. A drop below 50 could indicate further downside correction.
MACD (Moving Average Convergence Divergence): The MACD histogram is declining, and the signal line is showing signs of a potential bearish crossover. This indicates that while the bullish trend is still intact, buying momentum is decreasing, and further correction could be expected before a continuation of the uptrend.
Stochastic Oscillator: The stochastic is currently at 38.17, pointing downward. This suggests that the price could continue to correct in the short term before finding renewed buying interest at key support levels.
Support and Resistance:
Support: Immediate support is located at 0.6280, which aligns with the lower boundary of the ascending trendline and a key demand zone. Another support level is found at 0.6350, marking a previous breakout zone and price consolidation area.
Resistance: The nearest resistance level is at 0.6370, where the price is currently consolidating. If bullish momentum persists, the next major resistance level is at 0.6400, which coincides with recent highs and an important psychological barrier.
Conclusion and Consideration:
The AUD/USD pair on the H4 chart continues to maintain its bullish structure but faces a short-term correction phase. Traders should monitor Zone 1 for potential bullish re-entry opportunities. A break below 0.6350 could trigger further downside movement, while a breakout above 0.6370 would confirm the continuation of the uptrend. Given upcoming economic releases, volatility is expected. Traders should watch for USD strength or weakness following the US Building Permits and Housing Starts data, as well as Australian economic reports that may influence the AUD.
Disclaimer: The analysis provided for AUDUSD is for informational purposes only and does not constitute investment advice. Traders are encouraged to perform their own analysis and research before making any trading decisions on AUD/USD. Market conditions can change quickly, so staying informed with the latest data is essential.