Time Zone: GMT +2
Time Frame: 4 Hours (H4)
Fundamental Analysis:
Bitcoin (BTC) is currently experiencing potential volatility due to USD-related events. The U.S. market will have low liquidity today as banks remain closed for Presidents’ Day, which typically results in irregular volatility as institutional traders step aside, leaving room for speculative price swings. Additionally, speeches from Federal Reserve officials Patrick Harker and Michelle Bowman could provide insights into future U.S. monetary policy. A hawkish stance may strengthen the USD, adding bearish pressure on BTC USD, while a dovish tone could support risk assets like Bitcoin. Traders should remain cautious as thin liquidity can lead to unexpected price spikes or rapid moves in either direction.
Price Action:
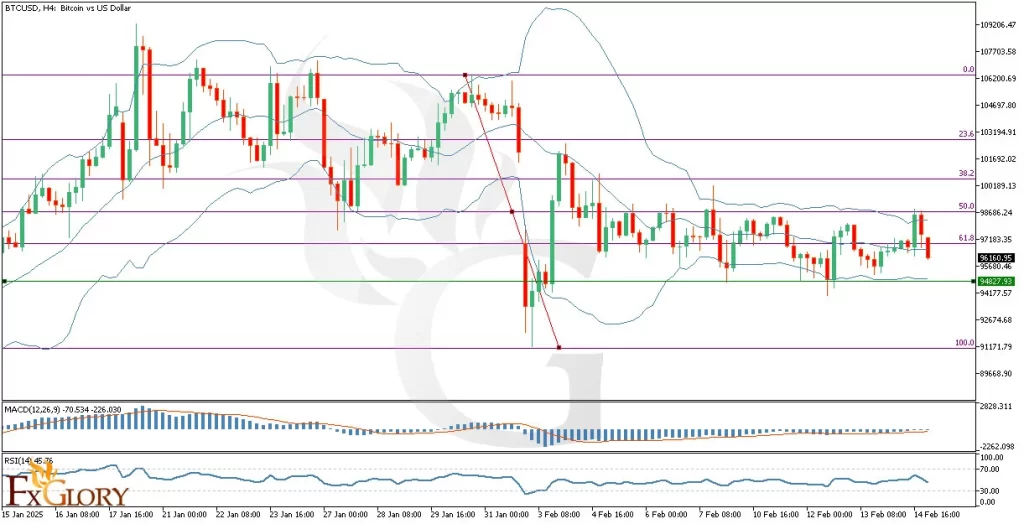
BTCUSD on the H4 timeframe is currently experiencing a bearish move after facing resistance at the 50% Fibonacci retracement level, leading to a sharp decline that has already broken below the 61.8% Fibonacci level. The price has moved from the upper Bollinger Band to the middle band and is now trending downward toward the lower band, signaling increased bearish pressure. If the price fails to hold above key support levels, further downside movement toward the lower Bollinger Band and the next Fibonacci support zones is likely.
Key Technical Indicators:
Bollinger Bands: The Bollinger Bands indicate that BTCUSD has moved downward from the upper band toward the middle band and is now attempting to break lower. This suggests that selling pressure is increasing, with a potential test of the lower Bollinger Band in the coming sessions. A confirmed break below the lower band could signal further bearish continuation, while a bounce from this area might indicate temporary consolidation before the next move.
MACD (Moving Average Convergence Divergence): The MACD histogram is showing strong bearish momentum, with the MACD line below the signal line, confirming a downside bias. The increasing separation between the MACD and signal lines suggests that selling pressure is still dominant. If the bearish momentum continues to grow, Bitcoin may extend losses toward key support levels. However, a weakening histogram could indicate that the downside move is slowing, signaling possible consolidation or reversal.
RSI (Relative Strength Index): The RSI is currently at 45.76, reflecting bearish sentiment but not yet reaching oversold conditions. This indicates that BTC/USD still has room to move lower before a potential reversal. If the RSI drops below 30, it would signal an oversold scenario, potentially triggering a short-term price correction. Until then, the bearish outlook remains intact, with a downward trend likely to persist in the near term.
Support and Resistance:
Support: The nearest support level is at $94,877, with a stronger support zone at $94,177, aligning with previous key price action areas.
Resistance: The immediate resistance level is at $97,183, with the next major resistance at $98,866, near the 50% Fibonacci retracement level.
Conclusion and Consideration:
BTCUSD on the H4 chart is currently in a bearish phase, as indicated by the break below the 61.8% Fibonacci level, declining MACD momentum, and RSI trending lower. The price movement from the upper Bollinger Band toward the lower band confirms the increasing selling pressure, with a high probability of further downside unless key support levels hold. With low liquidity due to the U.S. bank holiday, traders should be prepared for irregular volatility and possible sharp movements. Additionally, the upcoming speeches from Federal Reserve officials could provide unexpected market catalysts, influencing Bitcoin’s price action in correlation with USD movements. Caution is advised, and traders should employ proper risk management strategies while monitoring key levels for potential trade setups.
Disclaimer: The analysis provided for BTC/USD is for informational purposes only and does not constitute investment advice. Traders are encouraged to perform their own analysis and research before making any trading decisions on BTCUSD. Market conditions can change quickly, so staying informed with the latest data is essential.