Time Zone: GMT +2
Time Frame: 4 Hours (H4)
Fundamental Analysis:
The EUR/USD pair remains influenced by key economic events scheduled for today. On the USD side, multiple Federal Reserve (FOMC) members are set to speak, including Governor Philip Jefferson and Richmond Fed President Thomas Barkin. These speeches may provide insights into future monetary policy, which could impact the U.S. dollar’s strength. Additionally, the U.S. trade balance report and ISM Services PMI data are expected, adding further volatility to the market. For the EUR, upcoming Industrial Production and Services PMI reports are crucial for gauging economic strength within the Eurozone. A stronger-than-expected print may support the euro, while weaker data could extend the current bearish pressure on EUR/USD. Given the hawkish Fed expectations, the U.S. dollar could maintain its dominance unless there is a significant shift in tone from policymakers.
Price Action Analysis:
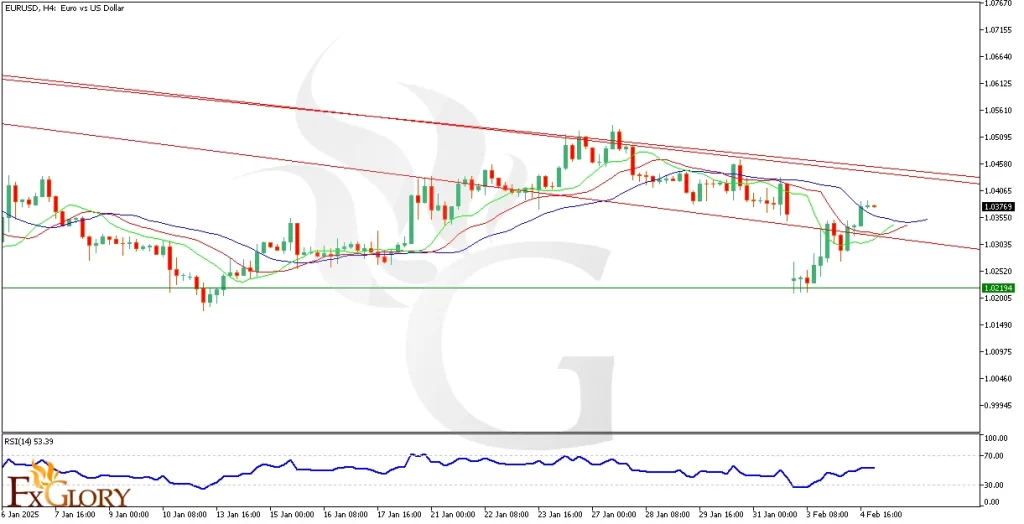
After a gap occurred, the price reacted to its support level at 1.02194, forming several doji candles, indicating market indecision. Following the gap closure, the price has broken the first resistance trendline and is now heading toward the second and third resistance levels. The price is currently moving within a descending channel, and a confirmed break above the next trendline resistance could shift the market structure towards a more bullish scenario.
Key Technical Indicators:
Alligator Trend Line: The alligator lines are beginning to cross upwards, indicating a potential bullish trend. If the price sustains above this pattern, further upside movement could be confirmed.
RSI (Relative Strength Index): The RSI is currently at 53.39, suggesting neutral momentum. However, if it moves beyond 60, a stronger bullish bias may develop.
Support and Resistance Levels:
Support: The nearest support level is positioned at 1.02194, which was previously tested during the price drop before the gap closure.
Resistance: The immediate resistance levels stand at 1.03768, which aligns with the broken trendline, followed by the next major resistance at 1.04500 and 1.05095, forming a descending channel’s upper boundary.
Conclusion and Consideration:
The EUR/USD H4 chart analysis shows a potential shift towards bullish momentum after breaking the first descending resistance trendline. However, upcoming fundamental events, including Fed speeches and key economic data, could significantly impact price movements. Traders should monitor resistance levels closely, as a breakout above 1.03768 could confirm further upside potential. Meanwhile, a failure to sustain gains might lead to another test of support at 1.02194.
Disclaimer: The analysis provided for EUR/USD is for informational purposes only and does not constitute investment advice. Traders are encouraged to perform their own analysis and research before making any trading decisions on EURUSD. Market conditions can change quickly, so staying informed with the latest data is essential.