Time Zone: GMT +2
Time Frame: 4 Hours (H4)
Fundamental Analysis:
The Australian Dollar (AUD) is currently facing downward pressure amid key economic data releases. The latest Melbourne Institute CPI report is expected to provide insights into consumer inflation, which directly impacts the Reserve Bank of Australia’s (RBA) monetary policy stance. Meanwhile, Australian Retail Sales and ANZ Job Advertisements reports will give a clearer picture of consumer spending and employment trends. Any signs of weakening economic activity could lead to further AUD depreciation. On the USD side, the market is watching S&P Global and ISM Manufacturing PMI, which will provide a broad economic outlook for the United States. Strong manufacturing data could boost the USD, leading to further AUDUSD declines. Additionally, Federal Reserve official Raphael Bostic’s speech might provide hints on future US interest rate policies, influencing market sentiment.
Price Action:
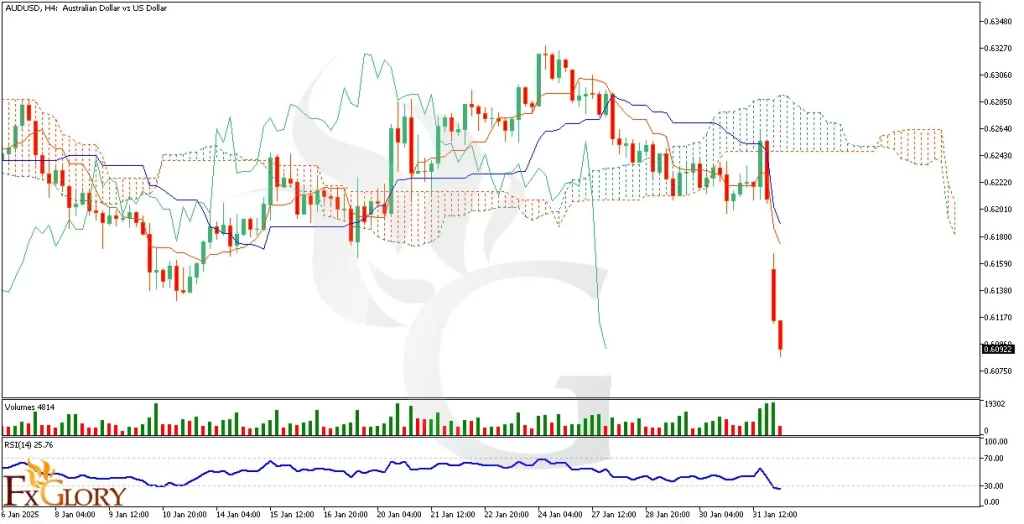
After the market opened, AUD/USD recorded a significant gap down, with price opening at a much lower level. The first few candles show two consecutive large red candles, indicating a strong bearish movement. This suggests increased selling pressure, likely fueled by fundamental catalysts favoring the USD. The price has broken below a key support zone, confirming strong bearish momentum.
Key Technical Indicators:
Ichimoku Cloud:The AUDUSD price is trading well below the Ichimoku Cloud, indicating a strong bearish trend. The Tenkan-sen (red line) and Kijun-sen (blue line) have crossed downward, reinforcing the bearish sentiment. Additionally, the future cloud is turning red, suggesting continued downside pressure.
Relative Strength Index (RSI): The RSI is currently at 25.76, deep in the oversold territory. This signals that the AUD USD pair is experiencing extreme selling pressure. However, it also suggests that a potential short-term correction or bounce might occur if buyers step in.
Volume: There is a notable increase in volume, supporting the strong bearish move. The high trading volume confirms that sellers are dominant in the market. However, if volume starts declining, it could indicate exhaustion of the bearish trend.
Support and Resistance Levels:
Support: Support level is seen around 0.6090, where price may stabilize; a break below could drive it toward 0.6050.
Resistance: Resistance level is near 0.6220, the previous breakdown level, with further resistance at 0.6285, aligning with the Ichimoku Cloud.
Conclusion and Consideration:
The AUDUSD H4 technical analysis indicates a strong bearish trend, supported by key technical indicators like Ichimoku Cloud, RSI, and Volume Analysis. Fundamentally, the strong USD data and weak AUD economic outlook are further driving the AUD-USD pair downward. While RSI suggests oversold conditions, the overall market sentiment remains bearish unless a significant catalyst reverses the trend. Traders should closely monitor upcoming Retail Sales and PMI data, which could introduce volatility. If economic data continues to favor the USD, further downside movement is likely. However, a technical bounce from oversold conditions is also possible.
Disclaimer: The analysis provided for AUD/USD is for informational purposes only and does not constitute investment advice. Traders are encouraged to perform their own analysis and research before making any trading decisions on AUDUSD. Market conditions can change quickly, so staying informed with the latest data is essential.


