Time Zone: GMT +2
Time Frame: 4 Hours (H4)
Fundamental Analysis:
Today, USDCAD traders will be paying close attention to key economic indicators and events affecting both the USD and CAD. On the CAD side, Statistics Canada will release Core Retail Sales data, a primary gauge of consumer spending. Positive retail figures could bolster CAD strength, as they reflect healthy economic activity. Additionally, the World Economic Forum in Davos might feature remarks from Canadian policymakers, potentially influencing the market.
For the USD, initial jobless claims from the Department of Labor are scheduled, serving as an essential indicator of labor market health. Lower-than-expected claims could reinforce USD strength. Additionally, developments in energy inventories and global crude oil prices will significantly impact CAD due to Canada’s reliance on the energy sector. Lastly, the World Economic Forum could spark USD volatility through central bank commentary.
Price Action:
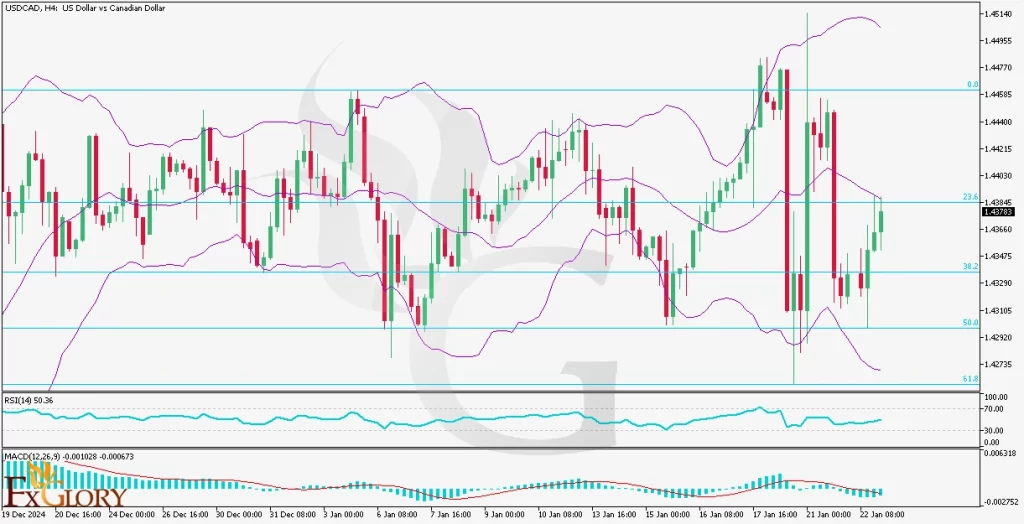
The USDCAD pair has been in a bullish trend on the H4 timeframe but exhibits fluctuating behavior between bullish and bearish movements. The USD/CAD price has been oscillating between the 38.2% and 23.6% Fibonacci retracement levels. Currently, the price is inching toward the 23.6% level, indicating potential further bullish movement. The USD CAD price has also rebounded from the lower Bollinger Band and is now aligning closer to the middle band, signifying improving bullish momentum.
Key Technical Indicators:
Bollinger Bands: The Bollinger Bands are widening, indicating increasing volatility. After testing the lower band, the price has moved toward the middle band, reflecting growing bullish sentiment. A sustained move above the middle band could confirm a continuation of the bullish trend.
Relative Strength Index (RSI): The RSI is currently at 50.36, sitting in neutral territory. This indicates neither overbought nor oversold conditions, leaving room for the USDCAD price to move higher. An upward push beyond 60 would signal strengthening bullish momentum.
MACD (Moving Average Convergence Divergence): The MACD histogram remains slightly negative but shows signs of recovery. The MACD line is approaching the signal line, suggesting that bullish momentum is building. A crossover into positive territory would confirm a bullish reversal.
Support and Resistance:
Support: Immediate support is located at 1.4320, aligning with the 50% Fibonacci retracement level and the lower Bollinger Band. A further drop would find stronger support at 1.4250, which coincides with recent lows and a critical psychological level.
Resistance: The nearest resistance is at 1.4385, situated at the 23.6% Fibonacci retracement level and close to the middle Bollinger Band. A breakout above this level would target the next significant resistance at 1.4450, aligning with the upper Bollinger Band and recent swing highs.
Conclusion and Consideration:
The USD-CAD H4 chart analysis suggests the bullish trend remains intact, supported by key indicators such as Bollinger Bands, RSI, and MACD. However, fluctuations between the 38.2% and 23.6% Fibonacci levels reflect short-term uncertainty. Traders should watch for a break above 1.4385 for bullish confirmation, while a dip below 1.4320 could signal bearish risks. Given today’s upcoming CAD Retail Sales data and USD labor market figures, volatility is likely. Traders should remain cautious of potential sharp moves. Energy inventory releases could also influence CAD due to oil market sensitivity.
Disclaimer: The analysis provided for USD/CAD is for informational purposes only and does not constitute investment advice. Traders are encouraged to perform their own analysis and research before making any trading decisions on USDCAD. Market conditions can change quickly, so staying informed with the latest data is essential.


