Time Zone: GMT +2
Time Frame: 4 Hours (H4)
Fundamental Analysis:
The AUDUSD pair reflects the exchange rate between the Australian Dollar (AUD) and the US Dollar (USD). Today, the US Dollar is expected to face mixed influences from a series of key economic data releases, including Retail Sales and Initial Jobless Claims. These indicators will provide insight into consumer spending and labor market conditions, both of which are critical for evaluating the overall health of the US economy. Additionally, the speech by Federal Reserve Bank of New York President John Williams might provide subtle clues regarding future monetary policy, impacting USD volatility. On the other hand, the AUD is being shaped by employment data and consumer inflation expectations. While the Australian labor market remains relatively stable, heightened inflation expectations could influence the Reserve Bank of Australia’s monetary outlook. These dynamics make the AUD USD pair a potential hotspot for volatility.
Price Action:
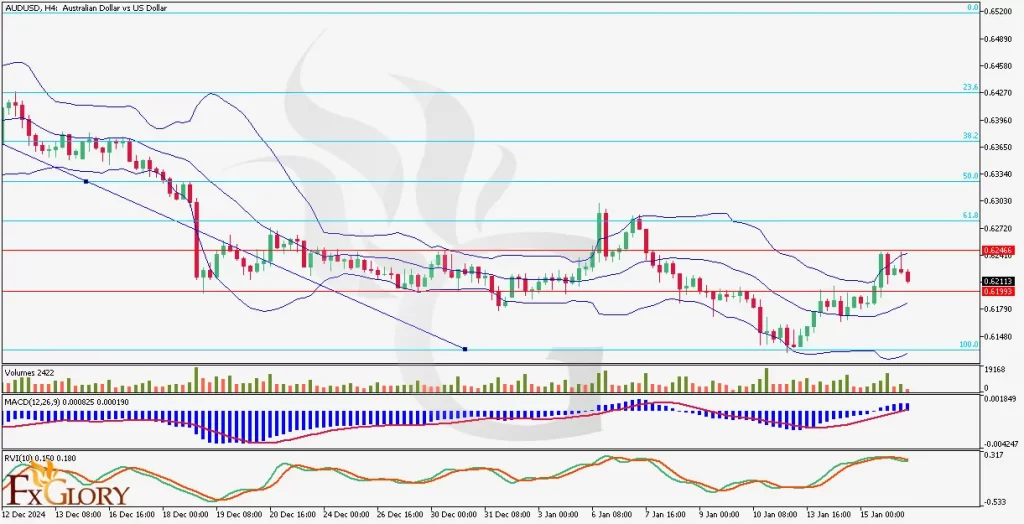
In the H4 timeframe, AUD/USD is currently in a bullish trend. However, after touching the first resistance level at 0.6246, the price has retreated, forming three bearish candles out of the last four. This suggests a weakening bullish momentum as the pair consolidates near the resistance zone. The current price action is testing support near 0.6211, with further downside risk if bearish sentiment persists.
Key Technical Indicators:
Bollinger Bands: The price has recently moved closer to the middle Bollinger Band, indicating consolidation after a bullish push. The narrowing Bands suggest a decrease in volatility, which may precede a breakout. The price remains above the lower band, keeping the bullish structure intact.
Volumes: Trading volumes show a steady decline, reflecting reduced market participation or hesitation near the resistance level. This aligns with the retreat from 0.6246, signaling a potential pause in bullish activity.
MACD (Moving Average Convergence Divergence): The MACD histogram is in positive territory, with the MACD line above the signal line. However, the diminishing histogram bars suggest weakening bullish momentum. Traders should watch for a potential crossover as an early sign of bearish pressure.
RVI (Relative Vigor Index): The RVI is beginning to slope downward, suggesting a shift in momentum towards bearishness. This indicator confirms the bearish candles seen in recent price action and signals caution for buyers.
Support and Resistance:
Support: Immediate support is located at 0.6211, which aligns with a recent price consolidation area and the middle Bollinger Band. Secondary support is found at 0.6193, corresponding to the 100% Fibonacci retracement level.
Resistance: The nearest resistance level is at 0.6246, coinciding with the first resistance zone where the price has recently retraced. Further resistance is located at 0.6272, aligning with the 61.8% Fibonacci retracement level and recent highs.
Conclusion and Consideration:
The AUDUSD pair on the H4 chart shows that while the bullish trend remains intact, the retreat from the resistance level at 0.6246 and the appearance of bearish candles suggest a potential shift in sentiment. The weakening MACD momentum and declining RVI emphasize caution, especially if the pair fails to hold above 0.6211. Traders should monitor today’s key US economic data and Australian developments, as these could introduce significant volatility.
Disclaimer: The analysis provided for AUD/USD is for informational purposes only and does not constitute investment advice. Traders are encouraged to perform their own analysis and research before making any trading decisions on AUDUSD. Market conditions can change quickly, so staying informed with the latest data is essential.
FXGlory
01.16.2025


