Time Zone: GMT +2
Time Frame: 4 Hours (H4)
Fundamental Analysis:
The USD/JPY currency pair is being influenced by contrasting economic conditions today. On the Japanese side, economic data highlights a mixed scenario, with reports from the Bank of Japan indicating potential optimism, as the Eco Watchers Index reflects moderate consumer sentiment improvements. However, attention remains focused on whether the BOJ will maintain its ultra-loose monetary policy. For the USD, key economic data, including the Core PPI and comments from a Federal Reserve official, could steer the dollar’s strength. With both currencies impacted by varied data, traders should expect choppy price movements as the market digests the economic updates.
Price Action:
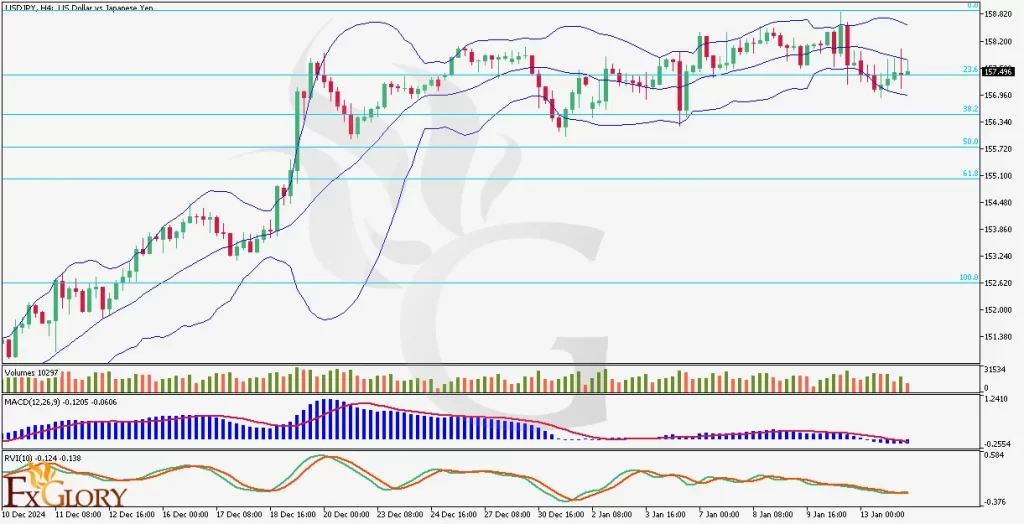
In the H4 timeframe, USDJPY is trading within a tight range, showing slight consolidation near the 23.6% Fibonacci retracement level of 157.50. The price recently moved upward, with five consecutive bullish candles indicating modest buying momentum. Despite this, the USD JPY pair lacks strong directional bias, suggesting traders are awaiting further catalysts to confirm the next trend direction. The movement between the Fibonacci level and the middle Bollinger Band signifies a phase of indecision in the market.
Key Technical Indicators:
Bollinger Bands: The USDJPY price has recently moved from the lower Bollinger Band toward the middle band, supported by five consecutive bullish candles. However, the price has yet to establish a sharp bearish or bullish trend. The narrowing of the Bollinger Bands indicates a period of low volatility, which often precedes significant price movement.
Volume: The volume indicator shows declining activity, reinforcing the market’s indecision phase. A breakout from current levels, accompanied by a volume increase, will be critical to confirm directional movement.
MACD (Moving Average Convergence Divergence): The MACD histogram displays decreasing momentum, with the MACD line hovering just below the signal line. This suggests a weakening bullish trend and the potential for a bearish crossover if momentum does not improve.
RVI (Relative Vigor Index): The RVI shows a mildly bearish reading, with the indicator lines sloping downward. This signals caution as the bears might gain strength, especially if the USD-JPY pair fails to sustain support at current levels.
Support and Resistance:
Support: Immediate support is located at 156.30, which aligns with the 38.2% Fibonacci retracement and serves as a critical level for maintaining bullish sentiment. A break below this level may lead the USD JPY price toward the 155.70 support, corresponding to the 50% Fibonacci retracement and providing a stronger downside buffer.
Resistance: The nearest resistance level is at 157.60, which coincides with the 23.6% Fibonacci retracement and recent highs. A breakout above this level could open the door for further bullish momentum toward 158.20, aligning with the upper Bollinger Band.
Conclusion and Consideration:
The USD/JPY pair on the H4 chart indicates consolidation near the 23.6% Fibonacci retracement level, with bullish momentum slowing as indicated by the MACD and volume metrics. Traders should watch for a breakout above 157.60 or a breakdown below 156.30 to confirm the next directional bias. The upcoming economic releases for both USD and JPY could serve as catalysts for these movements.
Disclaimer: The analysis provided for USD/JPY is for informational purposes only and does not constitute investment advice. Traders are encouraged to perform their own analysis and research before making any trading decisions on USDJPY. Market conditions can change quickly, so staying informed with the latest data is essential.


