Time Zone: GMT +2
Time Frame: 4 Hours (H4)
Fundamental Analysis:
Gold prices (XAU/USD) reflect mixed sentiment as traders prepare for the release of the US Monthly Treasury Statement. A higher-than-expected surplus could strengthen the US Dollar, pressuring Gold lower, while a deficit may boost Gold as a safe-haven asset. Broader market drivers, including concerns about inflation and central bank monetary policy, continue to influence Gold’s bullish momentum. The inverse correlation between the USD and Gold remains critical to monitor as today’s news unfolds.
Price Action:
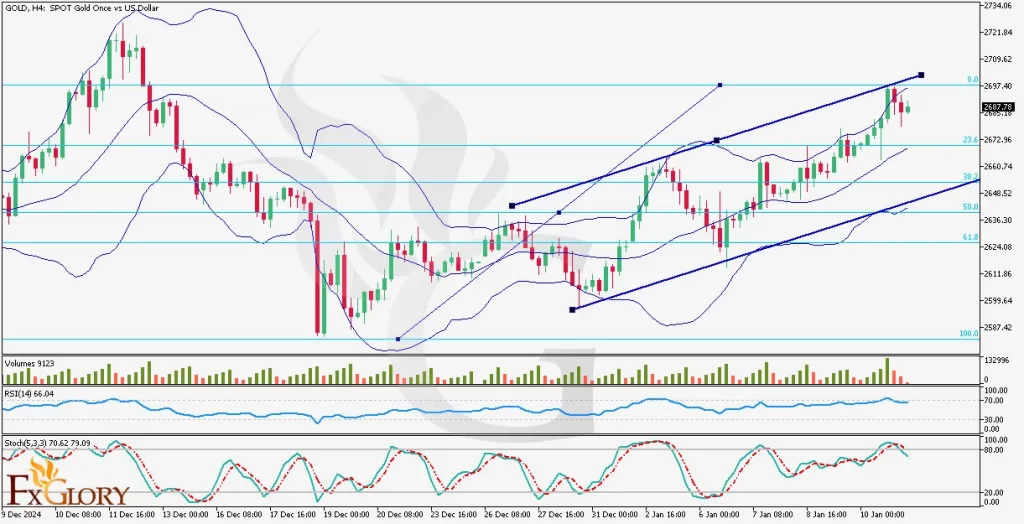
Gold price is moving in a well-defined bullish trend within an ascending channel on the H4 time frame. The price is currently testing the upper region of the Bollinger Bands, indicating strong buyer momentum. While a slight pullback is visible, the price remains comfortably above the 23.6% Fibonacci retracement level, with bulls eyeing a potential breakout near the 0% Fibonacci level for continued upward movement.
Key Technical Indicators:
Bollinger Bands: Gold’s price remains in the upper half of the Bollinger Bands, touching the upper line, which signals strong bullish momentum. The bands are slightly widening, suggesting increased volatility, while the recent pullback offers potential for buyers to re-enter.
RSI (Relative Strength Index): The RSI is at 66.04, hovering near overbought levels but not yet signaling an overextension. The indicator confirms bullish strength, but traders should be cautious of potential consolidation or minor corrections.
Stochastic Oscillator: The Stochastic Oscillator is near overbought territory at 70.62, which suggests the bullish move could slow down temporarily. Any crossover in this region might indicate short-term pullbacks or consolidation before a continuation.
Volume: Volume levels remain steady, aligning with the ongoing upward trend. Traders should watch for any divergence between price and volume, which could signal weakening momentum.
Support and Resistance Levels:
Support: The first support level lies at 2666.20, which aligns with the 23.6% Fibonacci retracement and holds as a critical bullish barrier. Below this, 2648.52 provides stronger support within the ascending channel, coinciding with the 38.2% Fibonacci retracement.
Resistance: Resistance is situated at 2687.78, near the current high and the 0% Fibonacci level, acting as a short-term ceiling for buyers. A breakout above this could drive prices toward the channel’s upper boundary near 2709.62, opening the door for further gains.
Conclusion and Consideration:
Gold USD (XAU/USD) on the H4 chart remains in a strong bullish structure, supported by the ascending channel and key Fibonacci levels. While technical indicators suggest overbought conditions, the price action supports the possibility of further upside, especially if buyers manage to push past the immediate resistance. Traders should keep a close eye on today’s US Treasury Statement, as it could introduce significant volatility. Caution is advised if the price breaks below the 23.6% Fibonacci level, which could signal a bearish correction.
Disclaimer: The analysis provided for GOLD/USD is for informational purposes only and does not constitute investment advice. Traders are encouraged to perform their own analysis and research before making any trading decisions on GOLDUSD. Market conditions can change quickly, so staying informed with the latest data is essential.


