Time Zone: GMT +2
Time Frame: 4 Hours (H4)
Fundamental Analysis:
The USD/CHF currency pair reflects the exchange rate between the US Dollar (USD) and the Swiss Franc (CHF). Today’s focus lies on two significant economic events. For the USD, the Chicago PMI and Pending Home Sales reports are expected to provide insights into the health of the US economy. A higher-than-forecast Chicago PMI would indicate expansion in business activity, supporting the USD. Meanwhile, robust Pending Home Sales data could strengthen the dollar further by reflecting healthy consumer demand. On the CHF side, the KOF Economic Barometer release is expected to give a forward-looking view of the Swiss economy. A stronger reading than forecast may boost the CHF, though the overall impact is likely to be moderate compared to the USD’s key data releases.
Price Action:
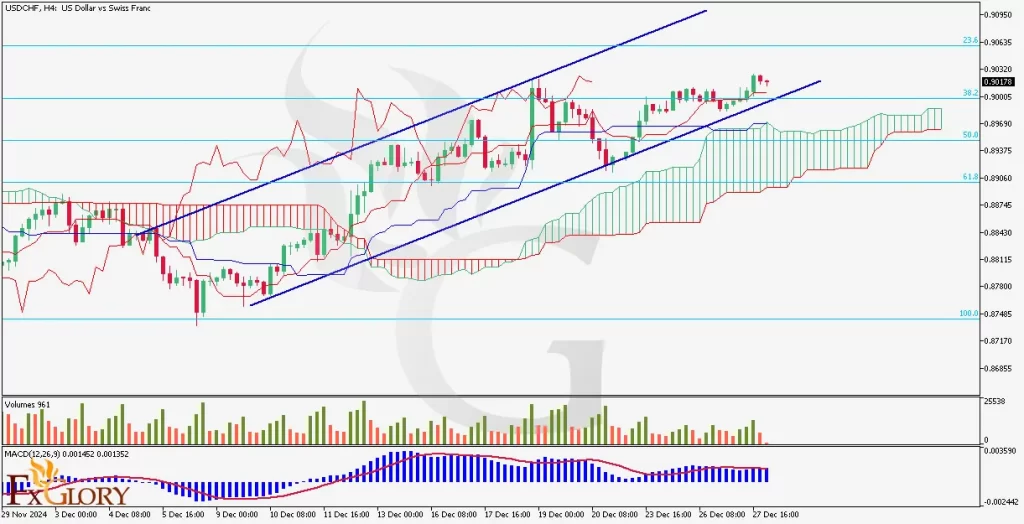
The USDCHF forex pair on the H4 chart remains in a bullish trend, trading within a well-defined ascending channel. Despite the last two bearish candles, the overall momentum stays intact, with the price consolidating near the 23.6% Fibonacci retracement level. The USD-CHF pair is currently positioned above the Ichimoku cloud, signaling a continuation of bullish sentiment. Buyers remain in control, but the price is showing signs of testing minor resistance at the upper boundary of the channel.
Key Technical Indicators:
IchiMoku Cloud: The USD CHF price is trading above the Ichimoku cloud, confirming a bullish trend. While the last two candles show minor pullbacks, the bullish momentum remains intact, as the price sustains its position above the cloud, indicating a strong support zone.
Volumes: The volume bars indicate a decrease in buying activity, with the last two candles accompanied by red volume bars. This suggests a slowdown in bullish momentum, warranting caution as the price approaches key resistance levels.
MACD (Moving Average Convergence Divergence): The MACD histogram remains positive, with the MACD line staying above the signal line. However, there are signs of waning momentum, as the histogram shows a slight reduction in bullish pressure. This could indicate potential consolidation before the next upward move.
Support and Resistance Levels:
Immediate Support: 0.90000, aligned with the lower boundary of the ascending channel and the 38.2% Fibonacci level.
Key Resistance: 0.90635, corresponding to the 23.6% Fibonacci retracement level and the upper boundary of the channel.
Conclusion and Considerations:
The USDCHF pair remains in a bullish trend on the H4 chart, supported by the Ichimoku cloud and the ascending channel. However, caution is advised as the last two bearish candles and declining volume indicate a potential consolidation phase. Traders should monitor the upcoming Chicago PMI and KOF Economic Barometer releases, as they could trigger increased volatility and influence the USDC/HF pair’s direction. A breakout above 0.90635 would confirm further bullish momentum, while a drop below 0.90000 may signal a short-term reversal.
Disclaimer: The analysis provided for USD/CHF is for informational purposes only and does not constitute investment advice. Traders are encouraged to perform their own analysis and research before making any trading decisions on USDCHF. Market conditions can change quickly, so staying informed with the latest data is essential.


