Time Zone: GMT +2
Time Frame: 4 Hours (H4)
Fundamental Analysis
The NZDUSD reflects the exchange rate between the New Zealand Dollar (NZD) and the U.S. Dollar (USD). Today, the USD’s performance will be closely tied to the release of key economic data, including GDP figures and Initial Jobless Claims. Stronger-than-expected data may bolster the USD, adding downward pressure on the NZDUSD pair. Meanwhile, New Zealand’s economic sentiment may hinge on business confidence data and risk appetite in global markets. Given the divergence in economic outlooks, traders should expect significant volatility during the U.S. session, as these releases will provide insight into the Federal Reserve’s future monetary policy.
Price Action
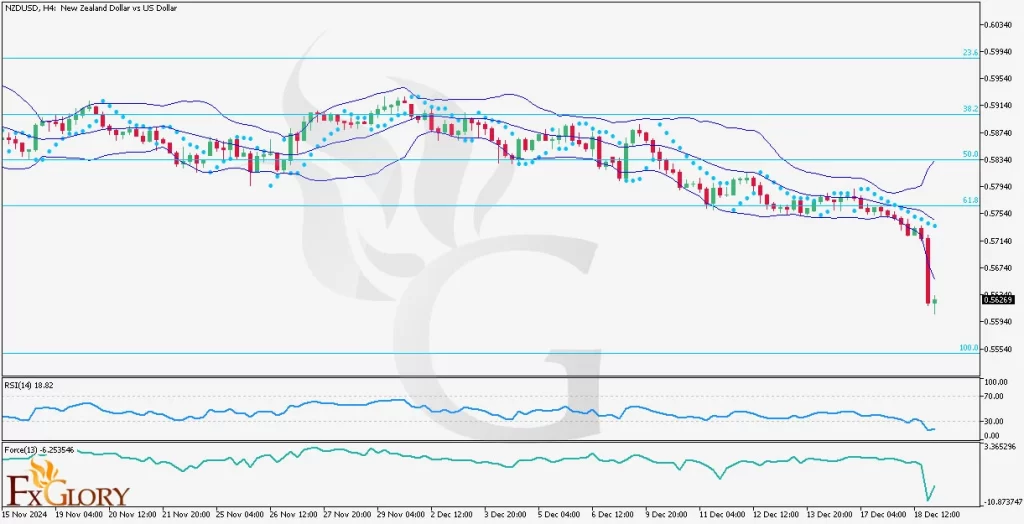
In the H4 timeframe, the NZDUSD pair continues to exhibit a strong bearish trend. The price has broken below the lower Bollinger Band, indicating intense selling pressure. This sharp decline has pushed the pair into oversold territory, as shown by key momentum indicators. While there might be a temporary retracement, bearish dominance persists, suggesting further downside risk.
Key Technical Indicators
Bollinger Bands: The NZDUSD price has decisively breached the lower Bollinger Band, signaling strong bearish momentum. The widening bands reflect increased volatility, and the price trading outside the bands indicates an extreme move, which may lead to a short-term corrective pullback.
Parabolic SAR: The Parabolic SAR dots are positioned above the candles, confirming the continuation of the bearish trend. This suggests that the downward momentum is firmly in place, and further declines are likely unless a significant reversal occurs.
RSI (Relative Strength Index): The RSI is currently at 18.82, deep in the oversold zone. While this level indicates strong bearish sentiment, it also raises the possibility of a short-term correction as the market may temporarily stabilize or retrace before continuing its downward movement.
Force Index: The Force Index, sitting at -6.23546, confirms the heavy selling pressure in the market. The negative value aligns with the bearish trend, signaling that bears remain in control without any immediate signs of reversal.
Support and Resistance Levels
Support: Immediate support is located at 0.5550, with a critical level at 0.5500, which aligns with the 100% Fibonacci retracement.
Resistance: The nearest resistance is at 0.5620, coinciding with the middle Bollinger Band and a previous consolidation zone. Further resistance can be seen at 0.5680, aligning with the 61.8% Fibonacci retracement.
Conclusion and Consideration
The NZDUSD pair on the H4 chart is in a strong bearish trend, as confirmed by the technical indicators, including Bollinger Bands, Parabolic SAR, RSI, and Force Index. The breach of key support levels, coupled with oversold conditions, suggests that while bearish momentum remains dominant, a short-term retracement could occur. Fundamental data from the U.S. will be pivotal in shaping the pair’s direction in the coming sessions. Traders should remain cautious, as increased volatility is expected due to the release of major economic indicators.
Disclaimer: The analysis provided for NZD/USD is for informational purposes only and does not constitute investment advice. Traders are encouraged to perform their own analysis and research before making any trading decisions on NZDUSD. Market conditions can change quickly, so staying informed with the latest data is essential.


