Time Zone: GMT +2
Time Frame: 4 Hours (H4)
Fundamental Analysis:
The USDCAD currency pair reflects the exchange rate between the U.S. Dollar (USD) and the Canadian Dollar (CAD). Today, key economic events for the CAD include multiple inflation data releases, such as CPI m/m (forecasted at 0.1%) and Core CPI m/m (expected at 0.4%). Lower-than-expected inflation data could signal subdued economic growth, potentially weakening the CAD. Simultaneously, significant U.S. economic releases include Core Retail Sales m/m (0.4%) and Retail Sales m/m (0.6%), which highlight consumer spending trends. If these data points outperform expectations, the USD may strengthen, increasing bullish pressure on the USD-CAD pair. Traders should remain attentive to these fundamental drivers as they could significantly impact price action throughout the session.
Price Action:
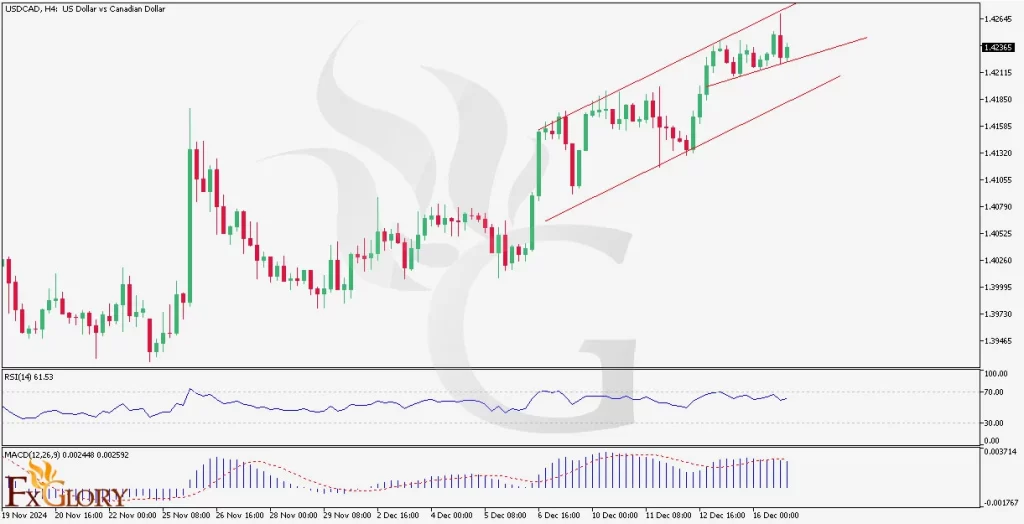
The USD CAD H4 chart reveals that the pair is trading within an ascending channel, indicating a short-term bullish trend. However, price has encountered strong resistance near the upper boundary of the channel at 1.42650, where selling pressure is starting to emerge. The most recent candlesticks exhibit rejection at this level, showing long wicks and small bodies, signaling a weakening bullish momentum. If the price fails to break higher, it could trigger a pullback toward key support areas at 1.42000 and 1.41760, reflecting a bearish correction within the overall bullish structure.
Key Technical Indicators:
RSI (Relative Strength Index): The RSI currently reads 61.53, indicating moderately overbought conditions. A negative divergence is evident, with price forming higher highs while the RSI forms lower highs. This suggests weakening momentum and signals a potential sell opportunity as the bullish strength fades.
MACD (Moving Average Convergence Divergence): The MACD line is curving downward, while the histogram shows shrinking bullish bars. This indicates a slowdown in upward momentum and confirms the negative divergence seen in the RSI. Traders should watch for a bearish crossover between the MACD line and signal line, which could validate a short-term correction.
Support and Resistance Levels:
Support: Immediate support is located at 1.42000, aligning with the lower boundary of the bearish channel and serving as a key area for potential rebounds. Additional support is found at 1.41760, marking a recent low that could attract buyers if the price continues to move downward.
Resistance: The nearest resistance level is at 1.42578, coinciding with the upper boundary of the bearish channel. A further resistance level is identified at 1.42777, which represents a more significant hurdle for bullish attempts and aligns with a prior swing high.
Conclusion and Consideration:
The USD/CAD pair on the H4 timeframe shows signs of exhaustion near key resistance at 1.42650. The RSI and MACD indicators highlight a negative divergence, signaling weakening bullish momentum and a possible pullback. Traders should closely monitor upcoming Canadian CPI data and U.S. Retail Sales, as these releases will heavily influence the USD and CAD. A break below 1.42000 would confirm a bearish correction, while stronger U.S. data could sustain the USD’s bullish stance. Given the sensitivity to economic data, risk management is essential in navigating potential volatility.
Disclaimer: The analysis provided for USD/CAD is for informational purposes only and does not constitute investment advice. Traders are encouraged to perform their own analysis and research before making any trading decisions on USDCAD. Market conditions can change quickly, so staying informed with the latest data is essential.


