
USDCHF Forecast

USD/CHF Live Price

0.82429
-0.08%

USD/CHF Forecast — 1 September 2026

Time Zone: GMT +3

Time Frame: Daily (D1) / Weekly Outlook

Weekly Fundamental Overview:

USD/CHF price dynamics reflect ongoing interaction between U.S. Dollar economic momentum and the Swiss Franc’s safe-haven status. Monetary policy expectations from the Federal Reserve and the Swiss National Bank continue to shape market sentiment, while broader global risk factors influence demand across currency pairs. Traders monitor U.S. economic performance alongside European financial conditions for further directional clarity.

Price Action:

On the daily (D1) chart, USD/CHF recently closed at 0.80823. Price action has shown a steady recovery from recent lows around 0.79732, moving back toward the 0.8090 area before consolidating slightly. The pair continues to trade within a broader range, seeking firm momentum to test higher resistance or retest support levels.

Key Technical Indicators:

Bollinger Bands: The daily Bollinger Bands reveal a middle band at 0.80746, an upper band at 0.81716, and a lower band at 0.79777. With the latest close at 0.80823 hovering just above the middle line, price action suggests a relatively neutral posture within the band channel.

RSI: The 14-day Relative Strength Index (RSI) stands at 51.45. Positioned near the neutral 50 mark, the indicator signals a balanced market condition without clear overbought or oversold pressure.

MACD: The MACD indicator is currently reading -0.000998, remaining slightly in negative territory. While histogram bars show modest consolidation, the negative reading indicates that broader upside momentum remains cautious on the daily timeframe.

Support and Resistance:

Key technical levels for USD/CHF on the daily chart include primary support at 0.79086 and primary resistance at 0.82054. Secondary technical reference levels are defined by the lower Bollinger Band at 0.79777 and the upper Bollinger Band at 0.81716.

News to Watch for USDCHF This Week:

  • ISM Services PMI: This release measures economic activity in the U.S. service sector and may influence U.S. Dollar sentiment.

Weekly Outlook and Consideration:

The weekly outlook for USD/CHF remains neutral to slightly balanced as price trades near 0.80823, close to the middle Bollinger Band at 0.80746. An RSI reading of 51.45 confirms the lack of strong directional bias, while MACD at -0.000998 points to muted momentum. A sustained move above upper band resistance around 0.81716 could pave the way toward major resistance at 0.82054. Conversely, a pullback below middle band support could see price retreat toward lower band levels near 0.79777 and key support at 0.79086.

Disclaimer: The analysis provided for USD/CHF is for informational purposes only and does not constitute investment advice. Traders are encouraged to perform their own analysis and research before making any trading decisions. Market conditions can change quickly, so staying informed with the latest data is essential.
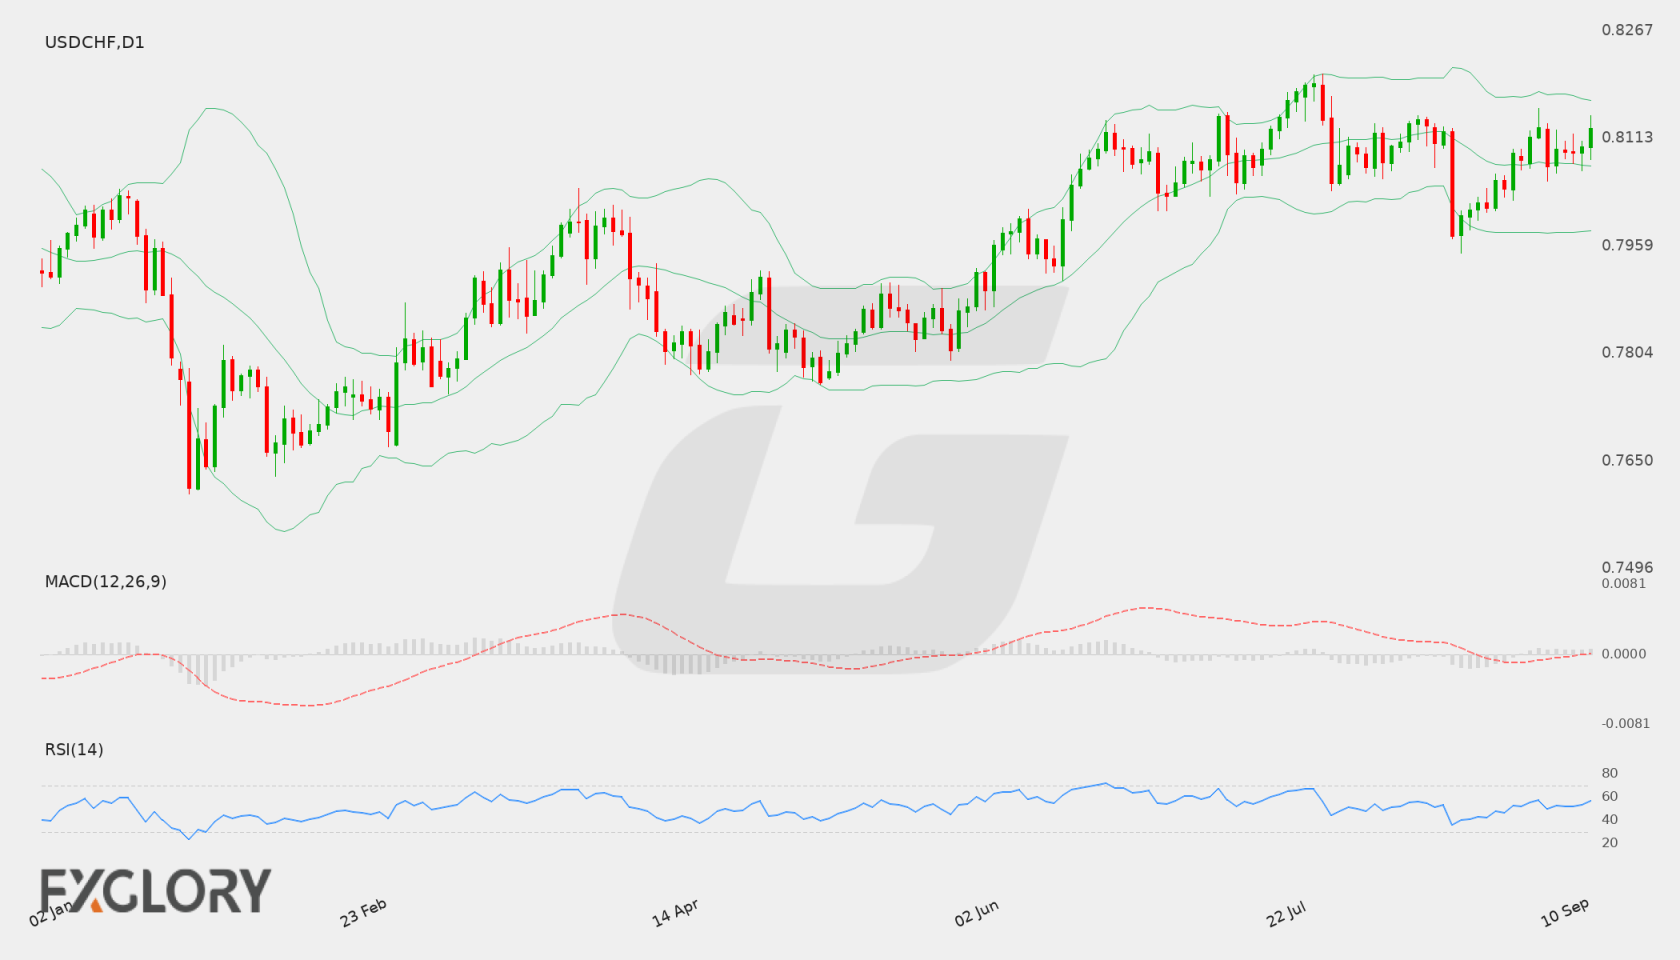
USD/CHF Forecast — 12 September 2026

Time Zone: GMT +3

Time Frame: Daily (D1) / Weekly Outlook

Weekly Fundamental Overview:

Fundamental sentiment for USD/CHF is driven by economic developments in Switzerland and the United States. Key monetary policy updates from the Federal Reserve along with Swiss price indices provide the primary macro backdrop for the currency pair.

Price Action:

On the Daily (D1) chart, USD/CHF recently closed at 0.81266. The pair has demonstrated upward momentum over recent sessions, moving higher from the 0.80930 level toward current market prices.

Key Technical Indicators:

Bollinger Bands: The Bollinger Bands indicator shows a middle band at 0.80738, an upper band at 0.81677, and a lower band at 0.79799. With the latest close at 0.81266, USD/CHF is trading above the middle band and approaching the upper boundary.

RSI: The 14-period Relative Strength Index (RSI) stands at 56.55, placing USD/CHF in neutral to moderately bullish territory without entering overbought conditions.

MACD: The MACD indicator registers a positive value of 0.00067. This reading above zero indicates mild bullish momentum on the D1 timeframe.

Support and Resistance:

Technical analysis highlights key horizontal levels for USD/CHF on the Daily timeframe, with immediate support identified at 0.79483 and primary resistance located at 0.82054.

News to Watch for USDCHF This Week:

  • PPI m/m: This release measures Swiss producer price changes and can influence Swiss Franc valuation.
  • Core Retail Sales m/m: This metric reflects US consumer spending excluding volatile items and impacts US Dollar sentiment.
  • Retail Sales m/m: Broad US retail sales data provides insight into overall economic health and dollar strength.
  • FOMC Economic Projections: Federal Reserve projections offer medium-term outlooks on growth and interest rates.
  • FOMC Statement: The policy statement details the Federal Reserve monetary stance.
  • Federal Funds Rate: The interest rate decision directly affects US Dollar yield expectations.
  • FOMC Press Conference: Leadership remarks clarify the monetary policy trajectory and drive market volatility.
  • Unemployment Claims: Weekly jobless claims data provides a fresh look at US labor market conditions.

Weekly Outlook and Consideration:

USD/CHF trades at 0.81266, positioned above its D1 Bollinger middle band of 0.80738. Technical indicators show an RSI of 56.55 and a positive MACD of 0.00067, suggesting a constructive price structure. Traders will monitor key support at 0.79483 and resistance at 0.82054 alongside upcoming central bank policy updates.

Disclaimer: The analysis provided for USD/CHF is for informational purposes only and does not constitute investment advice. Traders are encouraged to perform their own analysis and research before making any trading decisions. Market conditions can change quickly, so staying informed with the latest data is essential.
USD/CHF D1 technical analysis chart
USD/CHF D1 Technical Analysis for 09.12.2026

USD/CHF Forecast — 5 September 2026

Time Zone: GMT +3

Time Frame: Daily (D1) / Weekly Outlook

Weekly Fundamental Overview:

USD/CHF trading dynamic remains tied to US economic data releases and broader market risk sentiment. Market participants are closely watching upcoming US inflation reports, including producer and consumer price indices, which could influence interest rate expectations for the US dollar against the Swiss franc.

Price Action:

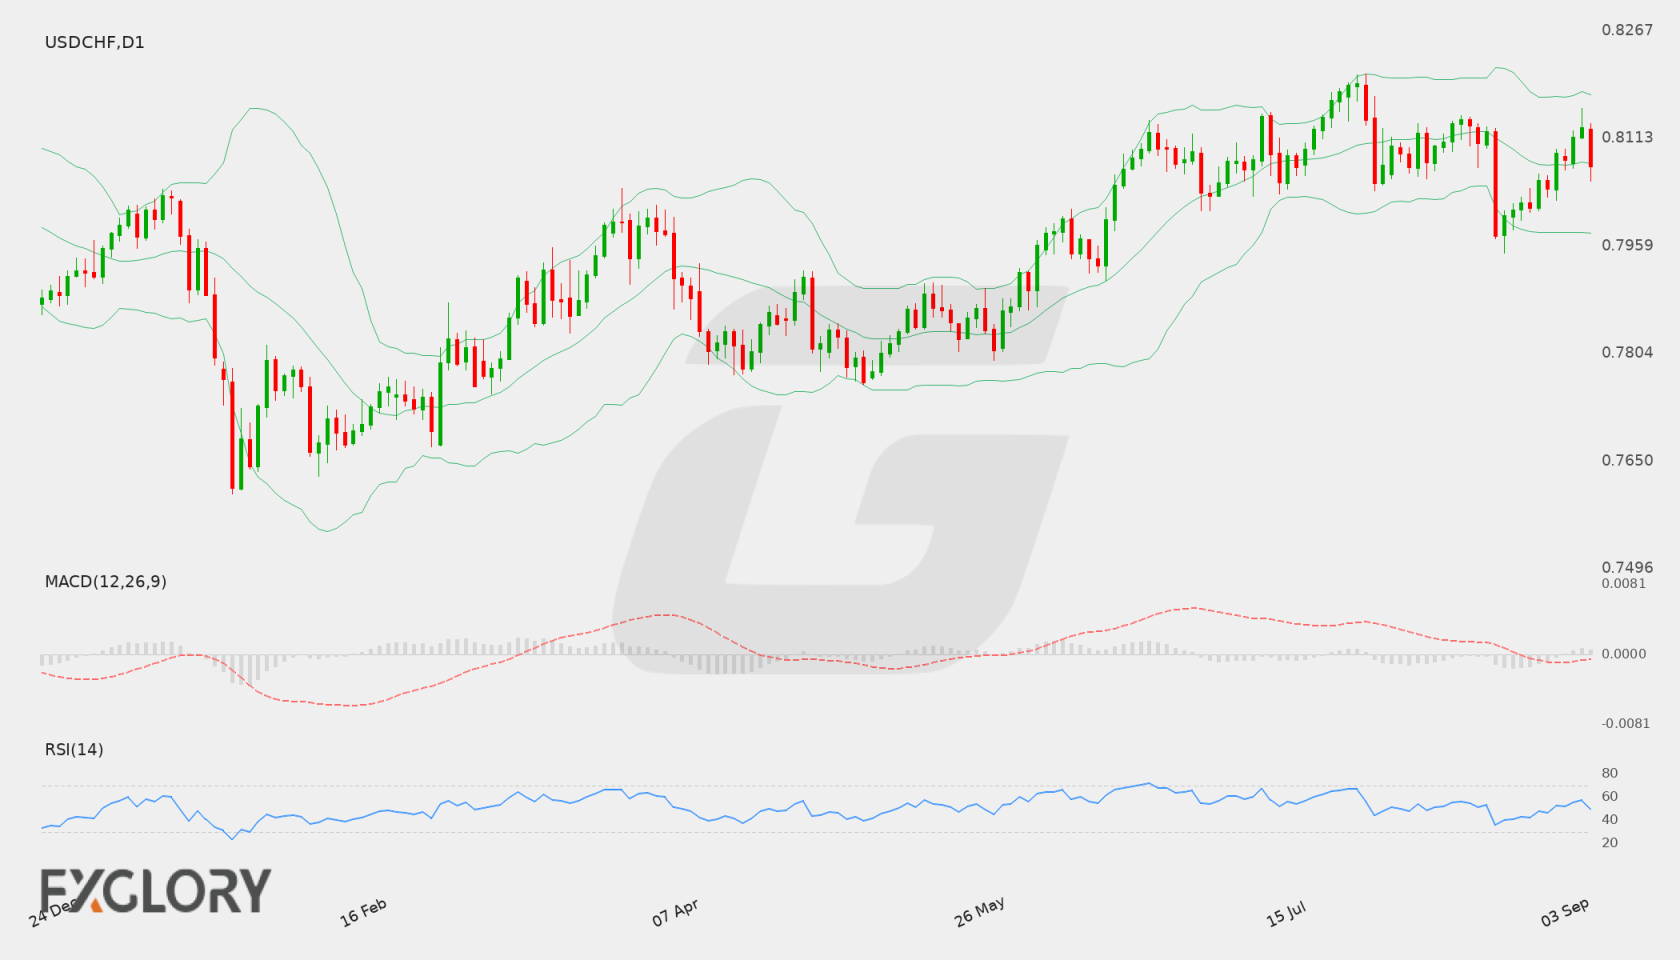
On the daily (D1) chart, USD/CHF pulled back from a recent high near 0.81280 to close at 0.80737. The pair is consolidating around its recent average after failing to extend gains toward key resistance levels.

Key Technical Indicators:

Bollinger Bands: The pair is currently hovering around the Bollinger middle band at 0.80763. The upper Bollinger band stands at 0.81753, while the lower band is located at 0.79773, indicating a period of moderate volatility.

RSI: The 14-day Relative Strength Index (RSI) is at 49.38, positioning the momentum firmly in neutral territory between oversold and overbought conditions.

MACD: The MACD indicator sits at -0.00004, remaining near the zero line, which suggests a balanced market sentiment with minimal directional bias on the daily timeframe.

Support and Resistance:

Key technical levels for USD/CHF show primary support at 0.79086 and overhead resistance at 0.82054.

News to Watch for USDCHF This Week:

  • PPI m/m: Measures wholesale inflation trends that influence US price pressure expectations.
  • Core PPI m/m: Tracks underlying producer prices excluding volatile categories to assess inflation momentum.
  • Unemployment Claims: Offers a weekly gauge of US labor market stability and employment trends.
  • Core CPI m/m: Reflects core monthly consumer inflation changes impacting Federal Reserve policy outlooks.
  • CPI y/y: Details annual consumer inflation shifts that affect broader US dollar demand.
  • Core CPI y/y: Indicates yearly changes in persistent consumer price trends.
  • CPI m/m: Shows monthly headline consumer price changes influencing interest rate expectations.
  • Prelim UoM Inflation Expectations: Captures consumer outlooks on future inflation expectations.
  • Prelim UoM Consumer Sentiment: Reflects overall consumer sentiment and economic confidence in the United States.

Weekly Outlook and Consideration:

USD/CHF enters the trading week in a neutral consolidation phase around the 0.80737 level. With RSI at 49.38 and MACD close to zero, technical indicators point to near-term indecision. A break above resistance at 0.82054 could re-ignite bullish momentum, whereas a decline below the lower Bollinger band at 0.79773 might bring support at 0.79086 into focus, depending on incoming US inflation data.

Disclaimer: The analysis provided for USD/CHF is for informational purposes only and does not constitute investment advice. Traders are encouraged to perform their own analysis and research before making any trading decisions. Market conditions can change quickly, so staying informed with the latest data is essential.

USD/CHF D1 technical analysis chart
USD/CHF D1 Technical Analysis for 09.05.2026

USD/CHF Forecast — 22 August 2026

Time Zone: GMT +3

Time Frame: Daily (D1) / Weekly Outlook

Weekly Fundamental Overview:

The USD/CHF pair is navigating a period shaped by key macroeconomic data releases. Key figures such as economic growth, labor market revisions, and inflation data will drive market sentiment around the US Dollar. Traders will evaluate whether persistent economic strength can bolster the Greenback against the Swiss Franc or if softening indicators will sustain selling interest. Overall market sentiment will depend on how upcoming fundamental data influences monetary policy expectations.

Price Action:

On the Daily (D1) chart, USD/CHF closed at 0.80017 following a retreat from higher levels earlier in the month. Price action recently recorded a daily low of 0.79483 before rebounding back above 0.8000. The recent sequence of candle closes reflects persistent downward momentum, though short-term buyers have stepped in near lower boundary areas to slow down the decline.

Key Technical Indicators:

Bollinger Bands: The Bollinger Bands indicator shows a middle line at 0.81053, an upper band at 0.82136, and a lower band at 0.79971. The last close of 0.80017 places USD/CHF right around the lower Bollinger Band. This position suggests price is testing the lower end of its recent volatility range, which could lead to either a breakdown or a short-term consolidation bounce.

RSI: The 14-day Relative Strength Index (RSI) is currently reading 39.84. Sitting comfortably below the 50 midpoint, the RSI signals prevailing bearish sentiment without reaching oversold conditions below 30.

MACD: The MACD indicator stands at -0.00084, remaining below the signal and zero lines. This negative value indicates that bearish momentum continues to dominate the current daily price structure.

Support and Resistance:

Key technical levels for USD/CHF on the daily timeframe include a primary support level at 0.7794 and a main resistance level at 0.82054.

News to Watch for USDCHF This Week:

  • CB Consumer Confidence: Reflects consumer sentiment trends that may impact economic momentum and US Dollar valuation.
  • Core PCE Price Index m/m: Provides key insights into consumer inflation trends that influence monetary policy expectations.
  • Prelim GDP q/q: Offers an updated snapshot of economic growth affecting broad market sentiment.
  • Prelim GDP Price Index q/q: Measures economy-wide inflation trends that can affect rate outlooks.
  • Unemployment Claims: Serves as an indicator of labor market conditions and economic stability.
  • Prelim Benchmark Payrolls Revision: Delivers significant updates to historical employment figures that could shift market confidence.

Weekly Outlook and Consideration:

The weekly perspective for USD/CHF remains cautious as technical indicators lean bearish on the D1 chart. With price hovering near the lower Bollinger Band at 0.79971, an RSI of 39.84, and a negative MACD of -0.00084, sellers remain in control of the near-term trend. However, holding above key support at 0.7794 could allow for consolidation or a recovery attempt toward the middle band and resistance at 0.82054, particularly if incoming economic releases support the US Dollar.

Disclaimer: The analysis provided for USD/CHF is for informational purposes only and does not constitute investment advice. Traders are encouraged to perform their own analysis and research before making any trading decisions. Market conditions can change quickly, so staying informed with the latest data is essential.

USD/CHF Forecast — 15 August 2026

Time Zone: GMT +3

Time Frame: Daily (D1) / Weekly Outlook

Weekly Fundamental Overview:

USD/CHF dynamics will be heavily influenced by macroeconomic updates from the US, as well as shifting risk sentiment. Economic data releases such as employment updates, regional manufacturing indexes, and central bank minutes could dictate near-term sentiment for the US Dollar, while market participants keep an eye on risk appetite affecting the Swiss Franc.

Price Action:

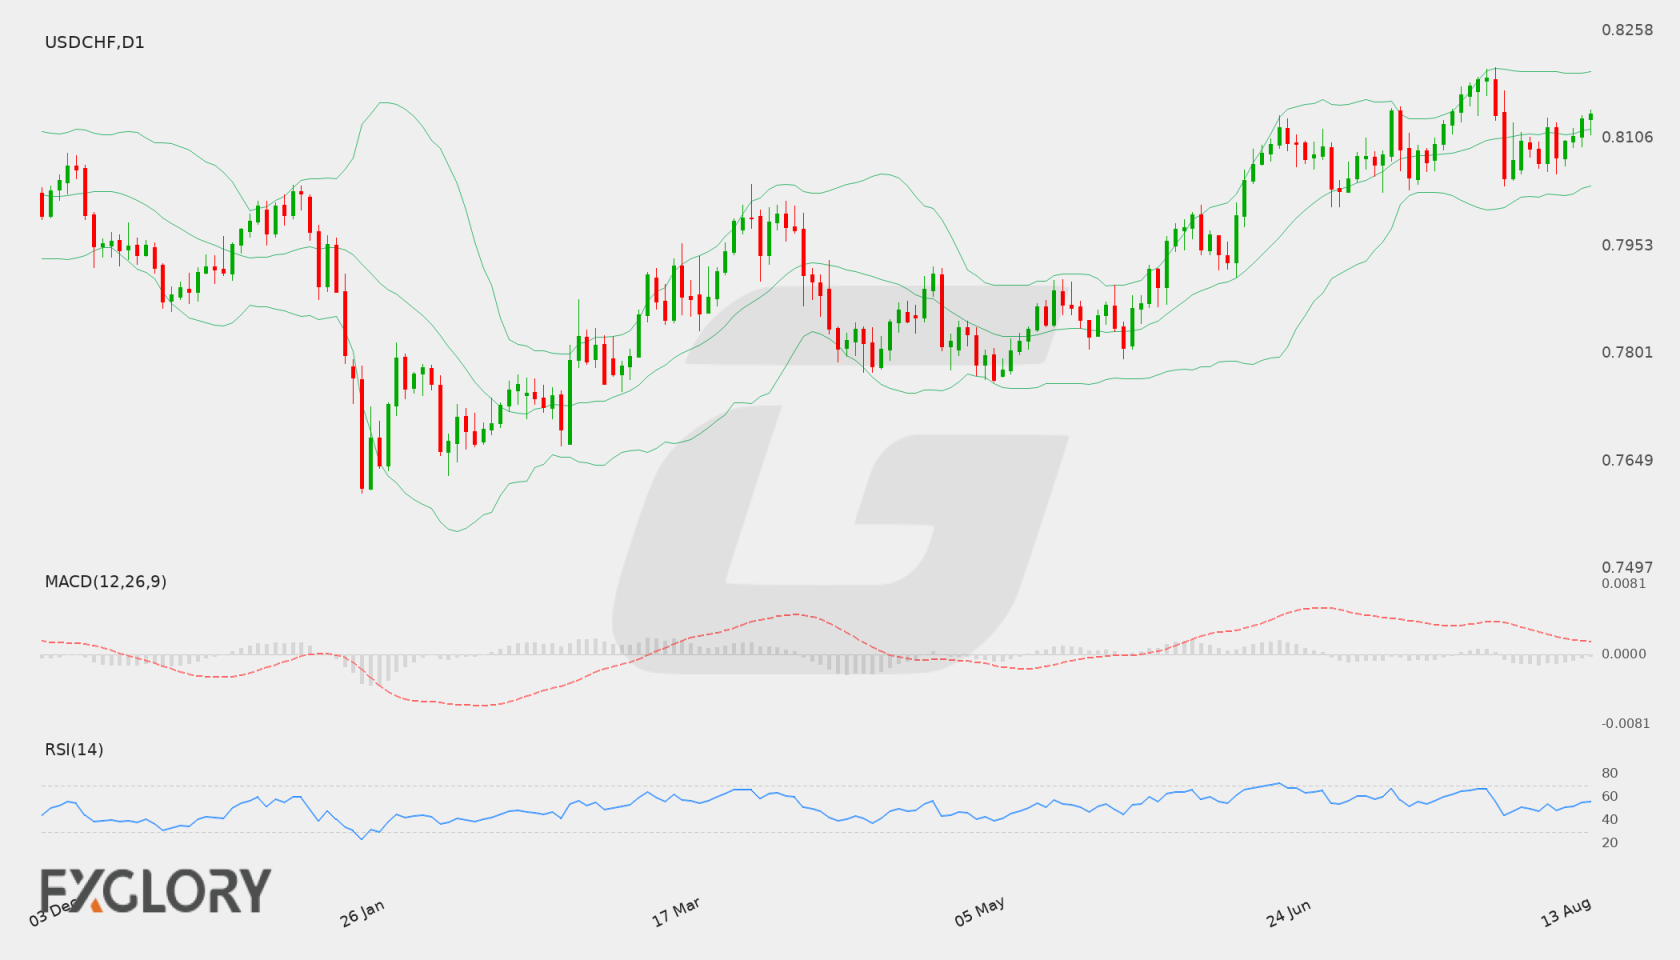
On the Daily (D1) chart, USD/CHF recently closed at 0.81398 following a series of modest gains from lower levels around 0.80715 earlier in the week. The pair displays short-term bullish momentum as buyers consistently keep price action elevated above recent consolidation points.

Key Technical Indicators:

Bollinger Bands: The Daily Bollinger Bands show a middle band (20-day SMA) at 0.81188, an upper band at 0.81996, and a lower band at 0.80381. With the latest close at 0.81398 hovering above the middle band, price action suggests a moderate upward bias toward the upper boundary.

RSI: The 14-day Relative Strength Index (RSI) stands at 56.04. This value remains in neutral territory above the 50 centerline, reflecting steady buying pressure without entering overbought conditions.

MACD: The MACD indicator is currently reading 0.00123. Operating in positive territory, the histogram indicates that mild bullish momentum remains intact for USD/CHF on the daily timeframe.

Support and Resistance:

Key technical levels for USD/CHF include primary support at 0.7794 and strong overhead resistance at 0.82054.

News to Watch for USDCHF This Week:

  • Prelim Benchmark Payrolls Revision: Benchmark employment revisions provide critical context on historical US labor market health.
  • FOMC Meeting Minutes: Detailed discussions from the central bank offer insight into future monetary policy sentiment.
  • Unemployment Claims: Weekly jobless updates indicate ongoing shifts in workforce stability.
  • Philly Fed Manufacturing Index: Regional business conditions serve as an indicator for broader industrial economic activity.
  • Flash Manufacturing PMI: Early purchasing manager surveys provide timely insight into overall sector strength.

Weekly Outlook and Consideration:

USD/CHF enters the week displaying a slightly bullish bias on the Daily chart, closing at 0.81398. Technical indicators align with this positive stance, as the RSI sits at 56.04 and the MACD displays a value of 0.00123. The pair currently trades above its Bollinger middle band of 0.81188, bounded by upper resistance at 0.82054 and lower support at 0.7794. While current technical signals favour potential tests of higher levels, incoming macroeconomic news and market volatility could alter direction.

Disclaimer: The analysis provided for USD/CHF is for informational purposes only and does not constitute investment advice. Traders are encouraged to perform their own analysis and research before making any trading decisions. Market conditions can change quickly, so staying informed with the latest data is essential.

USD/CHF D1 technical analysis chart
USD/CHF D1 Technical Analysis for 08.15.2026
1USD = –––CHF –––%
USDCHF
Loading chart...