Time Zone: GMT +2
Time Frame: 4 Hours (H4)
Fundamental Analysis
The NZDUSD currency pair reflects the strength of the New Zealand Dollar (NZD) against the US Dollar (USD). Key US economic events today include speeches from several Federal Reserve officials, notably Susan Collins and Beth Hammack, which could provide market-moving insights regarding monetary policy. Initial jobless claims data and the Philly Fed Manufacturing Index will also be closely watched for indications of labor market health and manufacturing activity in the US, which may influence USD volatility. Meanwhile, for the NZD, the Reserve Bank of New Zealand is set to release credit card spending data, a measure of consumer confidence and spending habits. Hawkish Fed commentary could strengthen the USD, while positive NZ consumer data might support the NZD.
Price Action
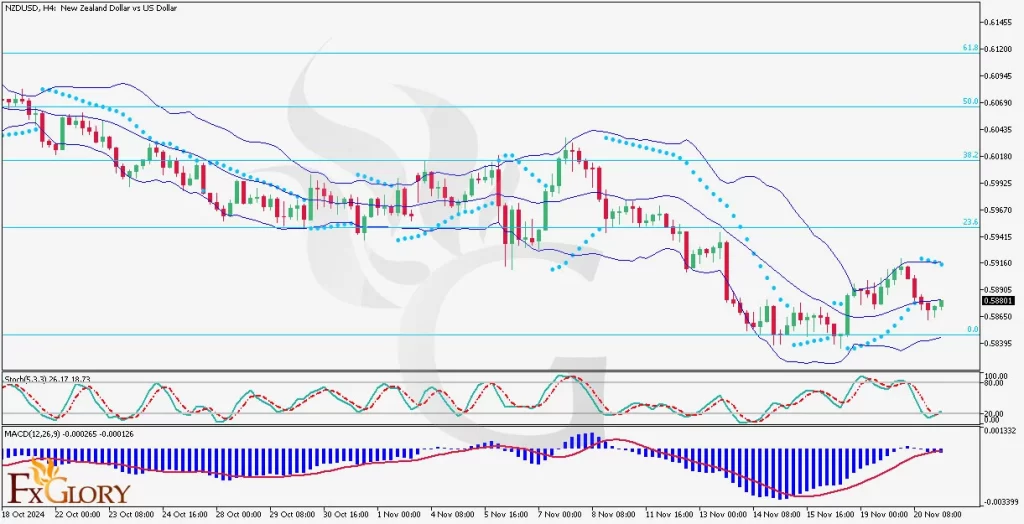
The NZD-USD pair on the H4 chart is currently trading below the 0.5900 level. After a bearish trend dominated earlier sessions, the pair is showing signs of recovery, moving toward the 23.6% Fibonacci retracement level. However, the last few candles suggest hesitation, with the price attempting to break through the middle Bollinger Band, reflecting a battle between bulls and bears. Traders should closely monitor whether the pair consolidates near the 23.6% Fibonacci level or reverses lower.
Key Technical Indicators
Parabolic SAR: The last four Parabolic SAR dots are above the price candles, signaling a continuation of bearish momentum. However, this may shift if the price can consolidate above the 23.6% Fibonacci level.
Bollinger Bands: The price is moving from the lower half of the Bollinger Bands back toward the middle band but has not decisively broken above it. This indicates indecision in the market, with a possible range-bound movement.
Stochastic Oscillator: The Stochastic is near the oversold level (currently at 18.23), suggesting a potential reversal to the upside. However, any breakout would depend on further confirmation from price action.
MACD (Moving Average Convergence Divergence): The MACD histogram shows diminishing bearish momentum, though the MACD line remains below the signal line. A potential crossover could indicate a shift to bullish sentiment, so traders should watch for further developments.
Support and Resistance
Support Levels: The primary support for NZD/USD is at 0.5860, which marks the recent low and serves as a psychological level, while 0.5820 represents a historical support zone with notable buying interest.
Resistance Levels: Resistance is positioned at 0.5905, aligning with the middle Bollinger Band as a minor hurdle, and 0.5960, corresponding to the 23.6% Fibonacci retracement, serving as a key target for bullish advances.
Conclusion and Consideration
The NZD USD pair on the H4 chart exhibits bearish undertones, though a potential reversal is indicated by oversold stochastic levels and weakening bearish momentum on the MACD. Traders should watch for a sustained break above the middle Bollinger Band (near 0.5900) as an early signal of bullish momentum. Upcoming speeches from Federal Reserve officials and US jobless claims data could drive significant volatility in the USD, while NZD traders will monitor credit card spending data for domestic cues.
Disclaimer: The analysis provided for NZD/USD is for informational purposes only and does not constitute investment advice. Traders are encouraged to perform their own analysis and research before making any trading decisions on NZDUSD. Market conditions can change quickly, so staying informed with the latest data is essential.


